Fig. 5
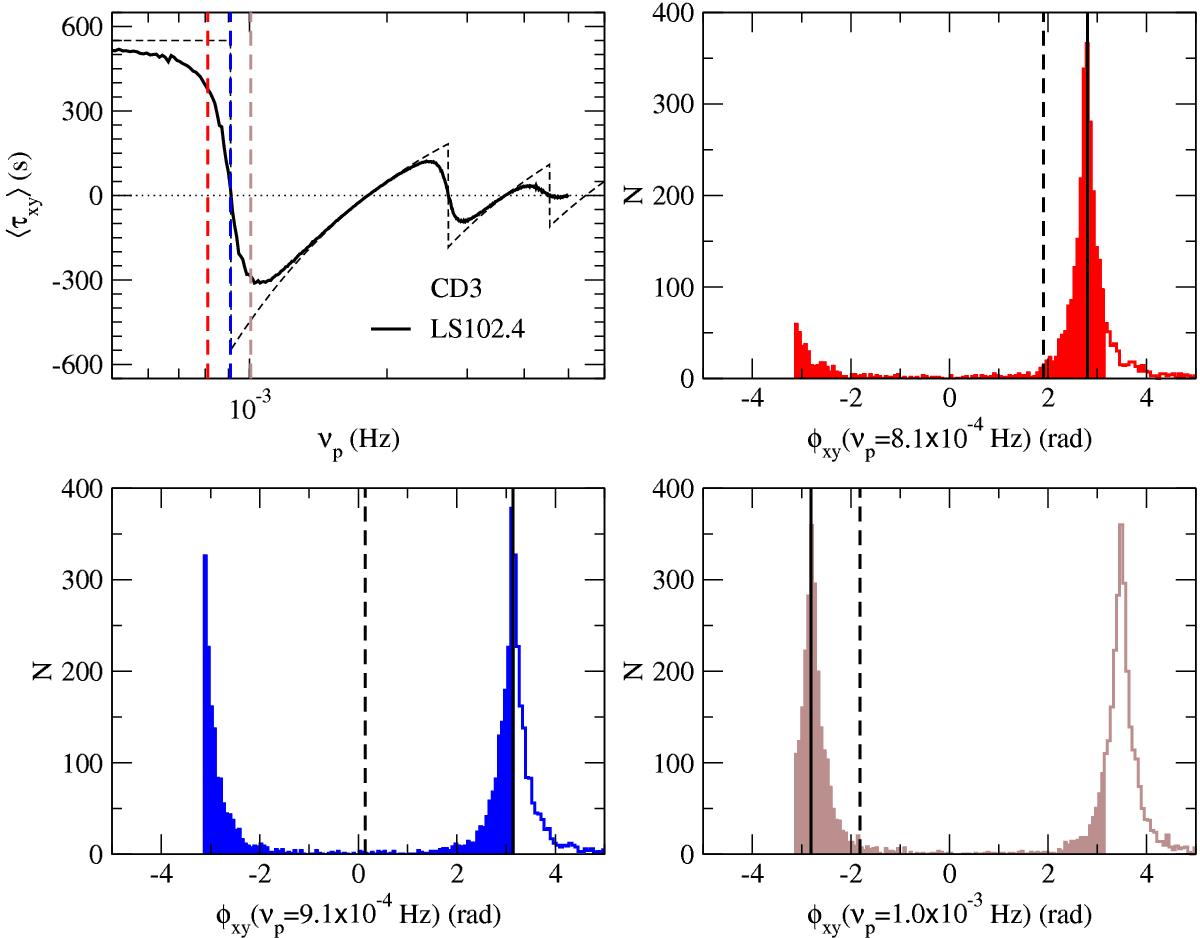
Top left panel: mean sample time-lag spectrum for the LS102.4 light curves in experiment CD3 (continuous black line). The black dashed line indicates the model time-lag spectrum. Top right and bottom panels: the probability distribution of the phase-lag estimates at the frequencies indicated by the vertical dashed lines in the top-left panel. The solid and dashed vertical line in these panels indicate the model and sample mean phase-lag value at these frequencies, respectively.
Current usage metrics show cumulative count of Article Views (full-text article views including HTML views, PDF and ePub downloads, according to the available data) and Abstracts Views on Vision4Press platform.
Data correspond to usage on the plateform after 2015. The current usage metrics is available 48-96 hours after online publication and is updated daily on week days.
Initial download of the metrics may take a while.