Fig. 4
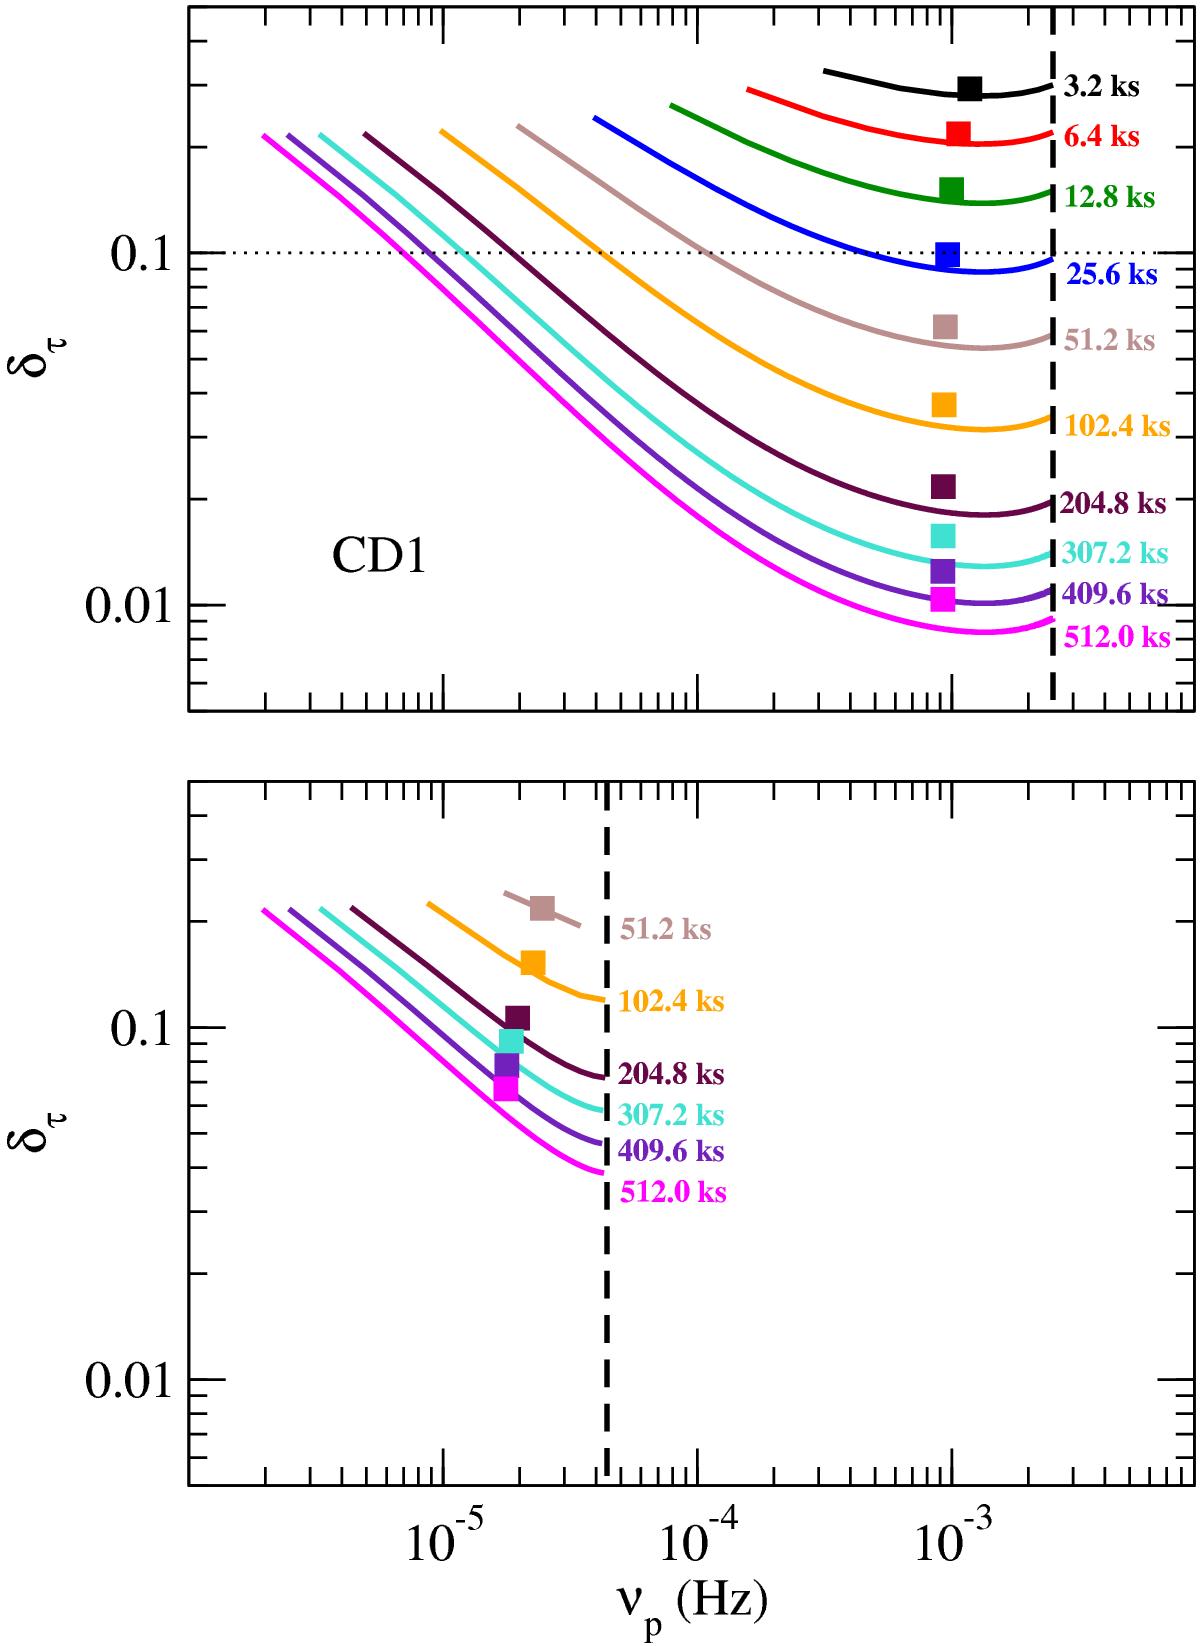
Relative time-lag bias for the LS- and OB-type light curves (top and bottom panel, respectively), for various durations in experiment CD1. Filled squares indicate the mean relative time-lag bias over the full sampled frequency range, evaluated at the mean logarithmic frequency. The dashed vertical line in the top and bottom panel indicate νNyq/ 2 for the LS- and OB-type light curves, respectively.
Current usage metrics show cumulative count of Article Views (full-text article views including HTML views, PDF and ePub downloads, according to the available data) and Abstracts Views on Vision4Press platform.
Data correspond to usage on the plateform after 2015. The current usage metrics is available 48-96 hours after online publication and is updated daily on week days.
Initial download of the metrics may take a while.