Fig. D.10
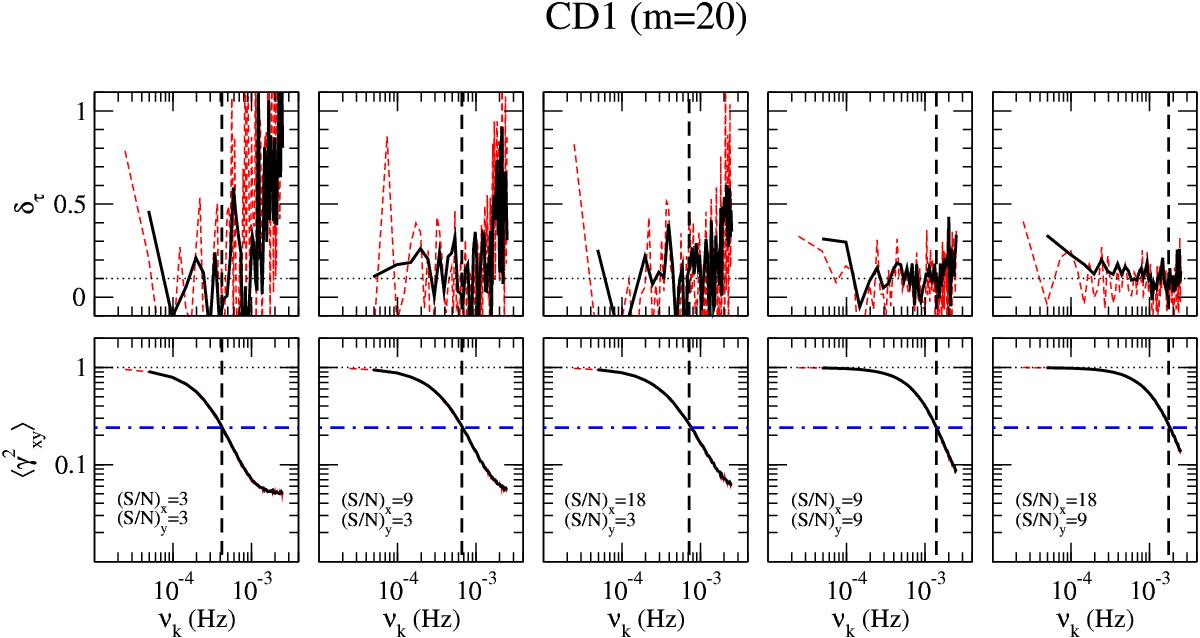
Top row: relative time-lag bias for the LS20.4 (continuous black curves) and LS40.8 (dashed red curves) light curves in experiment CD1. Bottom row: mean sample coherence for the LS20.4 (continuous black curves) and LS40.8 (dashed red curves) light curves in experiment CD1. Different columns correspond to different { (S/N)x,(S/N)y } combinations, while the estimates were determined from m = 20 segments in each case. The vertical dashed lines in all panels indicate νcrit, while the blue dotted-dashed lines in the lower panels indicate the 1.2/(1 + 0.2m) mean sample coherence value (see Sects. 8 and 9 for details).
Current usage metrics show cumulative count of Article Views (full-text article views including HTML views, PDF and ePub downloads, according to the available data) and Abstracts Views on Vision4Press platform.
Data correspond to usage on the plateform after 2015. The current usage metrics is available 48-96 hours after online publication and is updated daily on week days.
Initial download of the metrics may take a while.