Free Access
Fig. 2
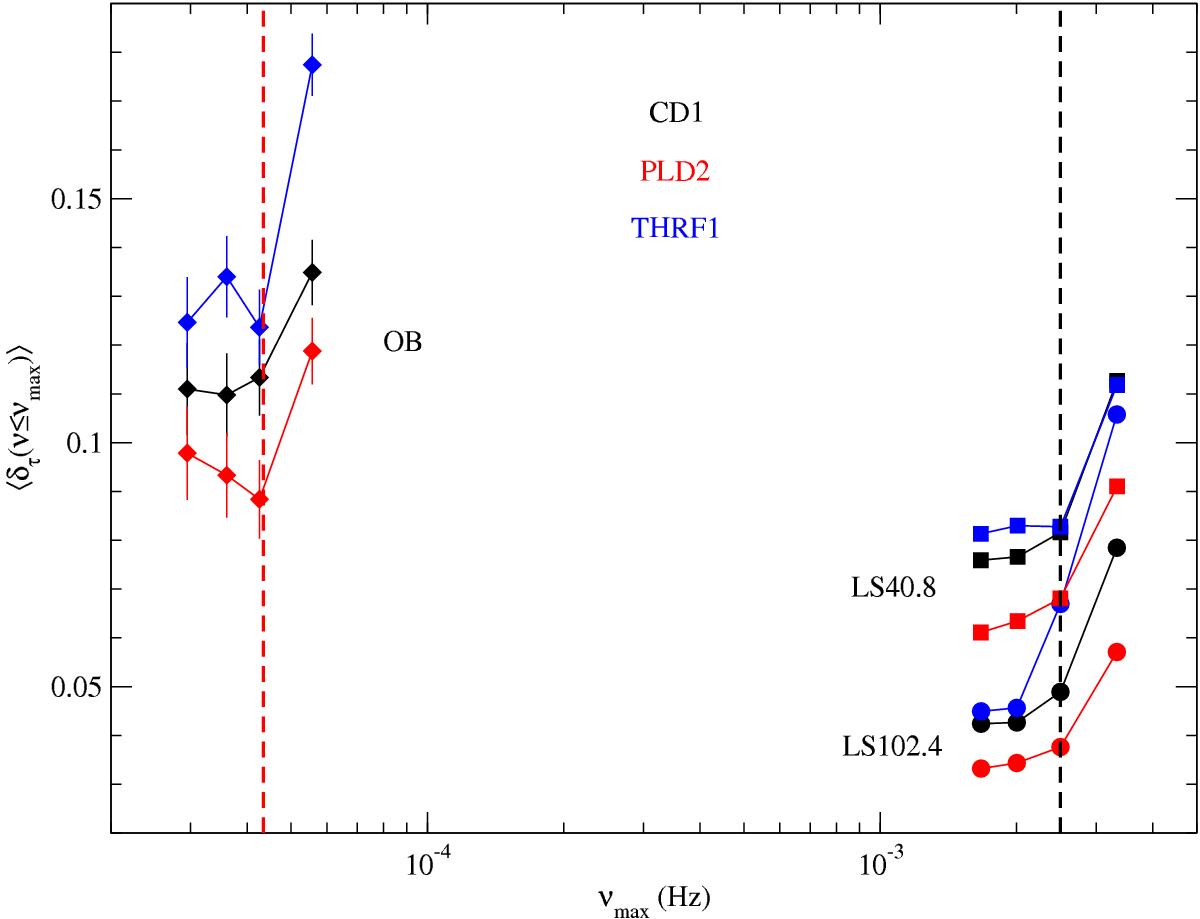
Mean relative time-lag bias over all frequencies below νmax, plotted as a function of νmax, for different light curve types in various numerical experiments. The left and right dashed vertical lines indicate νNyq/ 2 for the OB- and LS-type light curves, respectively.
Current usage metrics show cumulative count of Article Views (full-text article views including HTML views, PDF and ePub downloads, according to the available data) and Abstracts Views on Vision4Press platform.
Data correspond to usage on the plateform after 2015. The current usage metrics is available 48-96 hours after online publication and is updated daily on week days.
Initial download of the metrics may take a while.