Fig. D.5
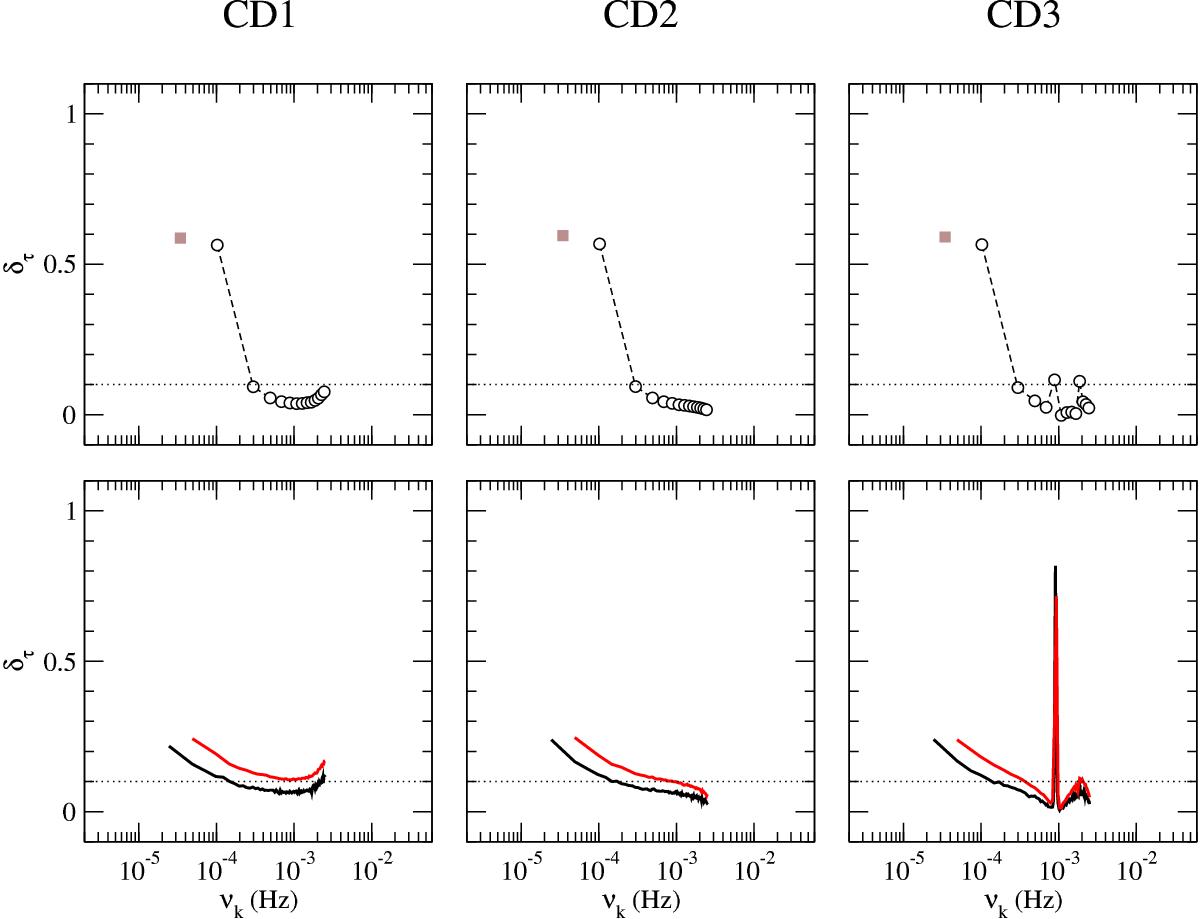
Relative time-lag bias for experiments CD1 (first column), CD2 (second column), and CD3 (third column). Top row: relative time-lag bias for the LS102.4 light curves with a smoothing parameter m = 20 (open black circles), and OB light curves with a smoothing parameter m = 13 (filled brown squares). Bottom row: relative time-lag bias for the LS40.8 (black curves) and LS20.4 (red curves) light curves in the case of m = 20 segments.
Current usage metrics show cumulative count of Article Views (full-text article views including HTML views, PDF and ePub downloads, according to the available data) and Abstracts Views on Vision4Press platform.
Data correspond to usage on the plateform after 2015. The current usage metrics is available 48-96 hours after online publication and is updated daily on week days.
Initial download of the metrics may take a while.