Fig. 6
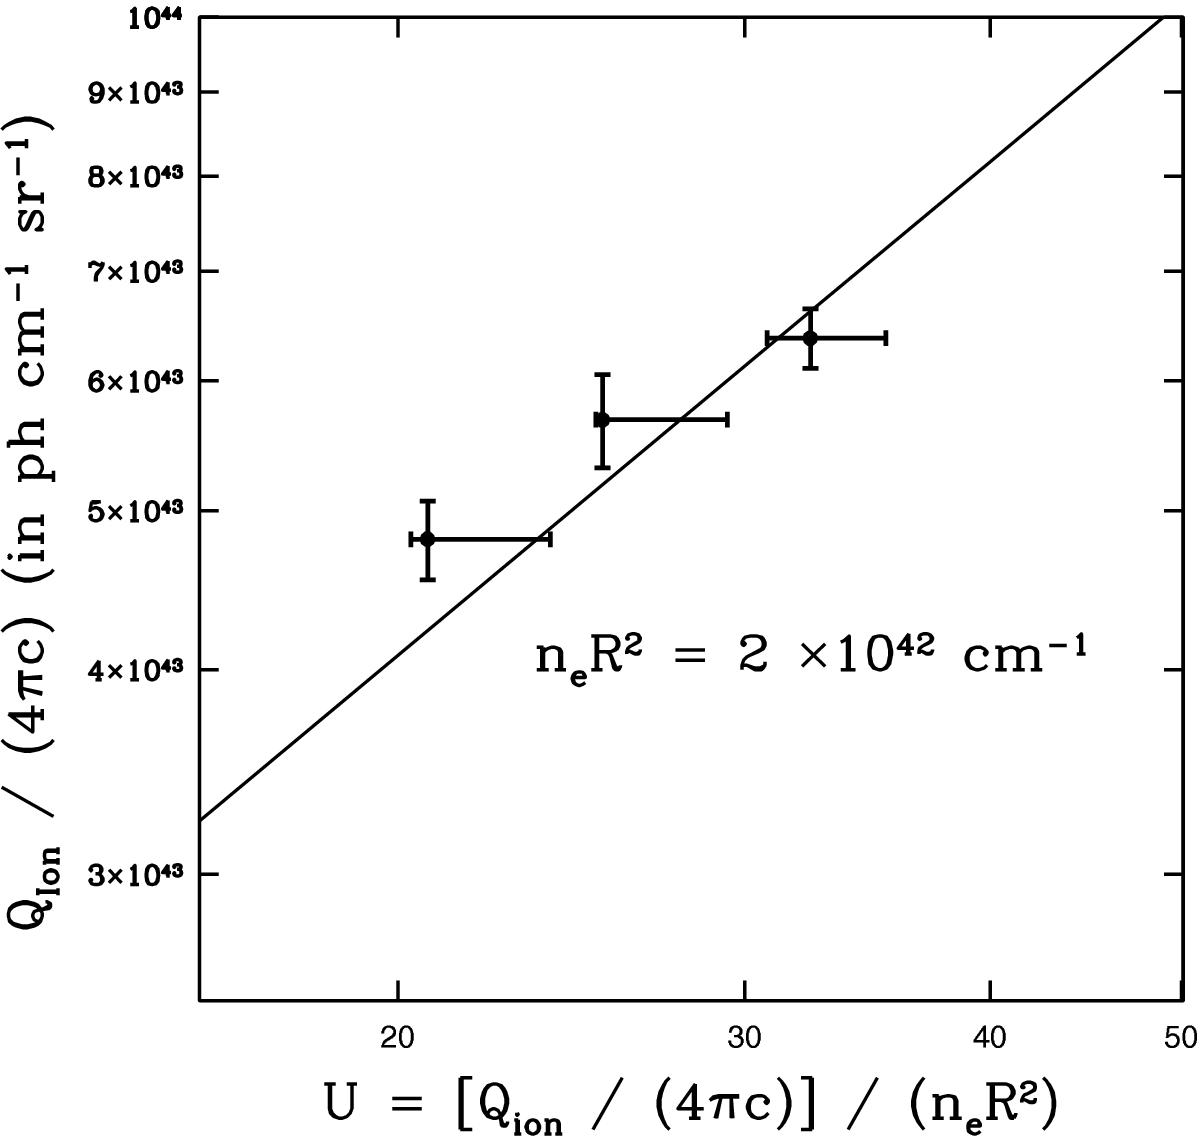
Best-fitting number Qion of ionizing photons at the illuminated face of the absorbing cloud of gas (divided by the quantity 4πc), vs. the best-fitting ionization parameter, U, for the three flux-interval spectra HS, MS and LS. Both the x and y-axis are in logarithmic scale. The straight line indicates the best-fitting linear relationship between log(Qion) and log (U), whose intercept provides an estimate for the quantity neR2 (see Sect. 4.2).
Current usage metrics show cumulative count of Article Views (full-text article views including HTML views, PDF and ePub downloads, according to the available data) and Abstracts Views on Vision4Press platform.
Data correspond to usage on the plateform after 2015. The current usage metrics is available 48-96 hours after online publication and is updated daily on week days.
Initial download of the metrics may take a while.