Free Access
Fig. 3
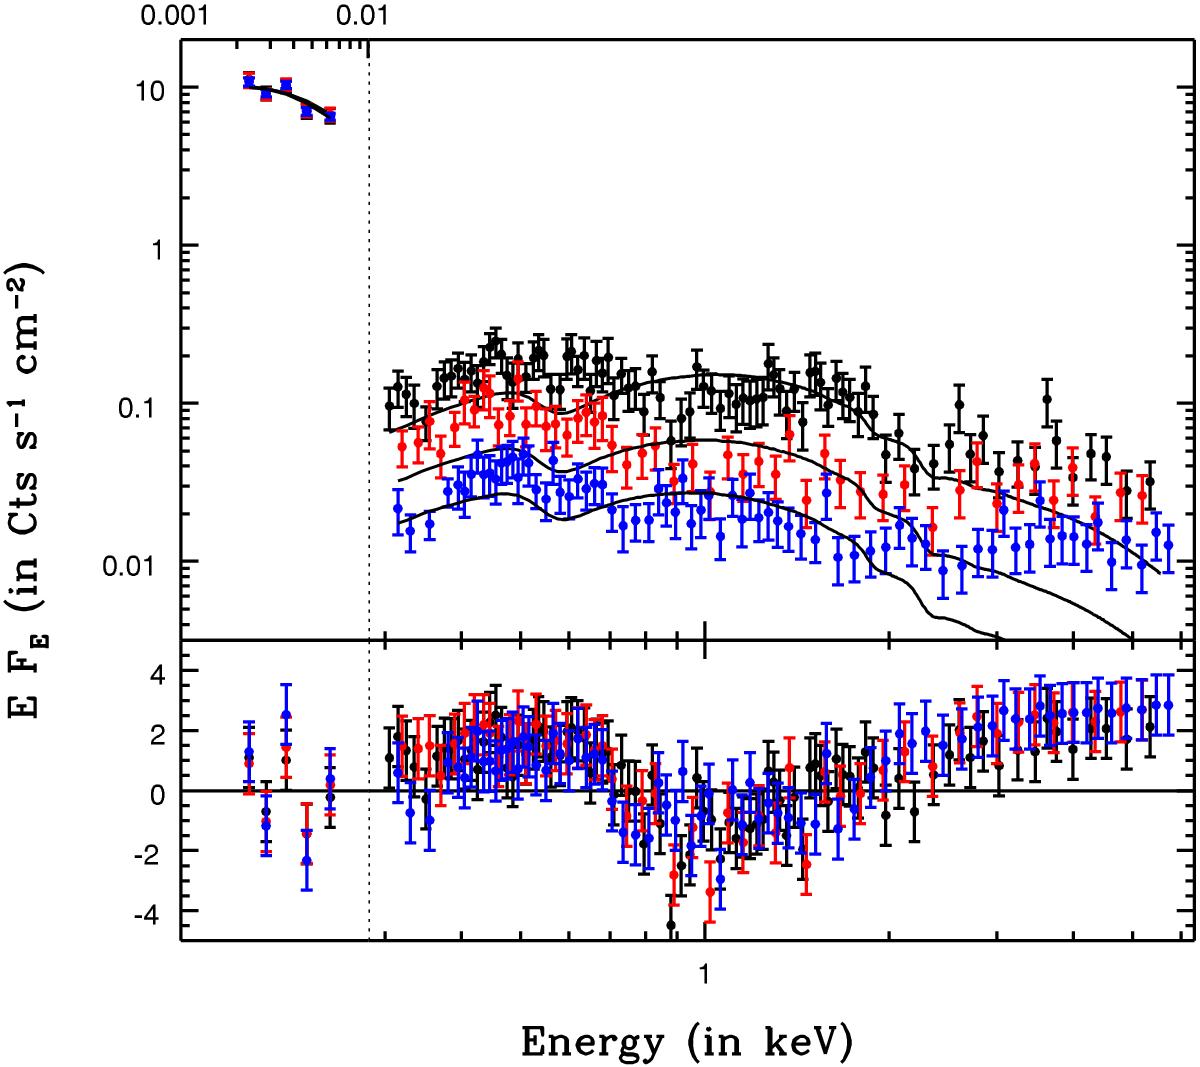
Broad-band spectra of PG1211+143 in its HF (black), MF (red), and LF (blue) flux; super-imposed are the corresponding best-fitting model A lines (top panel) and the residuals (in standard deviations) between the data and their best-fit models (bottom panel).
Current usage metrics show cumulative count of Article Views (full-text article views including HTML views, PDF and ePub downloads, according to the available data) and Abstracts Views on Vision4Press platform.
Data correspond to usage on the plateform after 2015. The current usage metrics is available 48-96 hours after online publication and is updated daily on week days.
Initial download of the metrics may take a while.