Fig. A.1
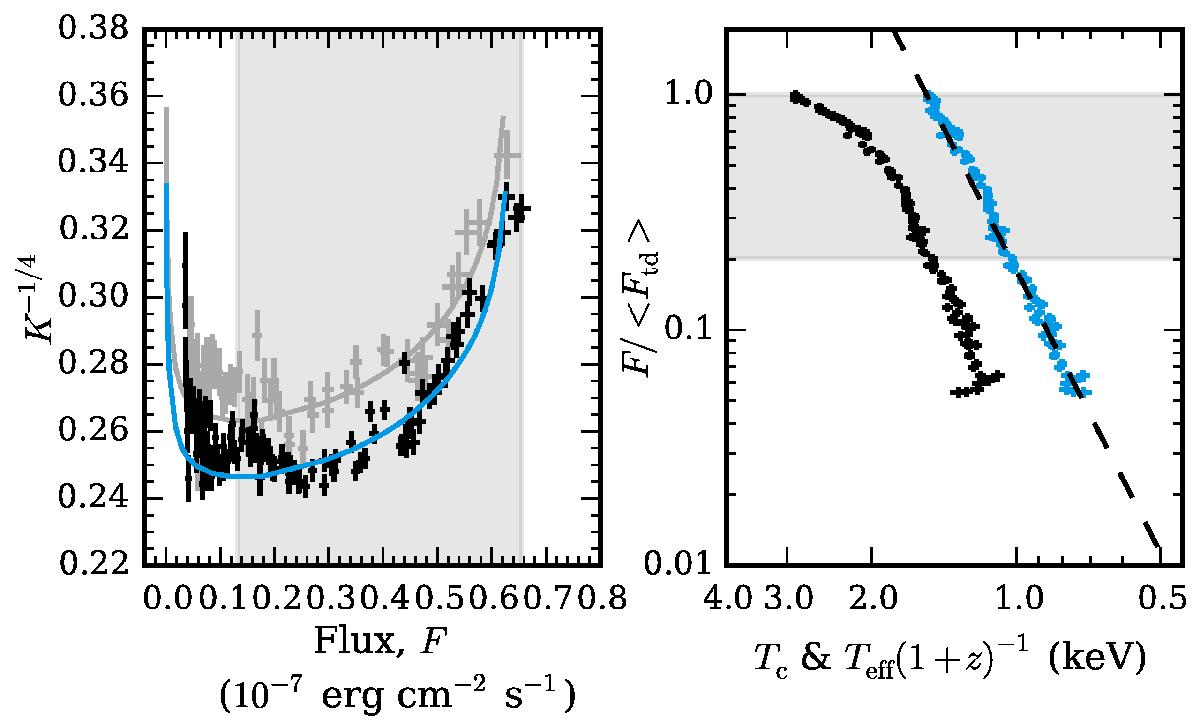
Left-hand panel: cooling tail in the F ∝ L/LEdd vs. K− 1 / 4 ∝ fc plane with 1σ errors presented by black crosses for a hard-state PRE burst from 4U 1724−307 analyzed by Suleimanov et al. (2011b). Best-fit theoretical atmosphere model is shown with the blue curve (SolA001). A PRE burst from the same source (used in the this paper) is also presented with gray crosses and gray curve. Right-hand panel: temperature evolution of the Suleimanov et al. (2011b) burst. Blackbody temperature Tbb is shown for the cooling tail with black crosses. Blue crosses show the color-corrected temperatures Teff(1 + z)-1. The straight inclined lines show a powerlaw with an index of 4 corresponding to the F ∝ T4 relation.
Current usage metrics show cumulative count of Article Views (full-text article views including HTML views, PDF and ePub downloads, according to the available data) and Abstracts Views on Vision4Press platform.
Data correspond to usage on the plateform after 2015. The current usage metrics is available 48-96 hours after online publication and is updated daily on week days.
Initial download of the metrics may take a while.