Fig. 3
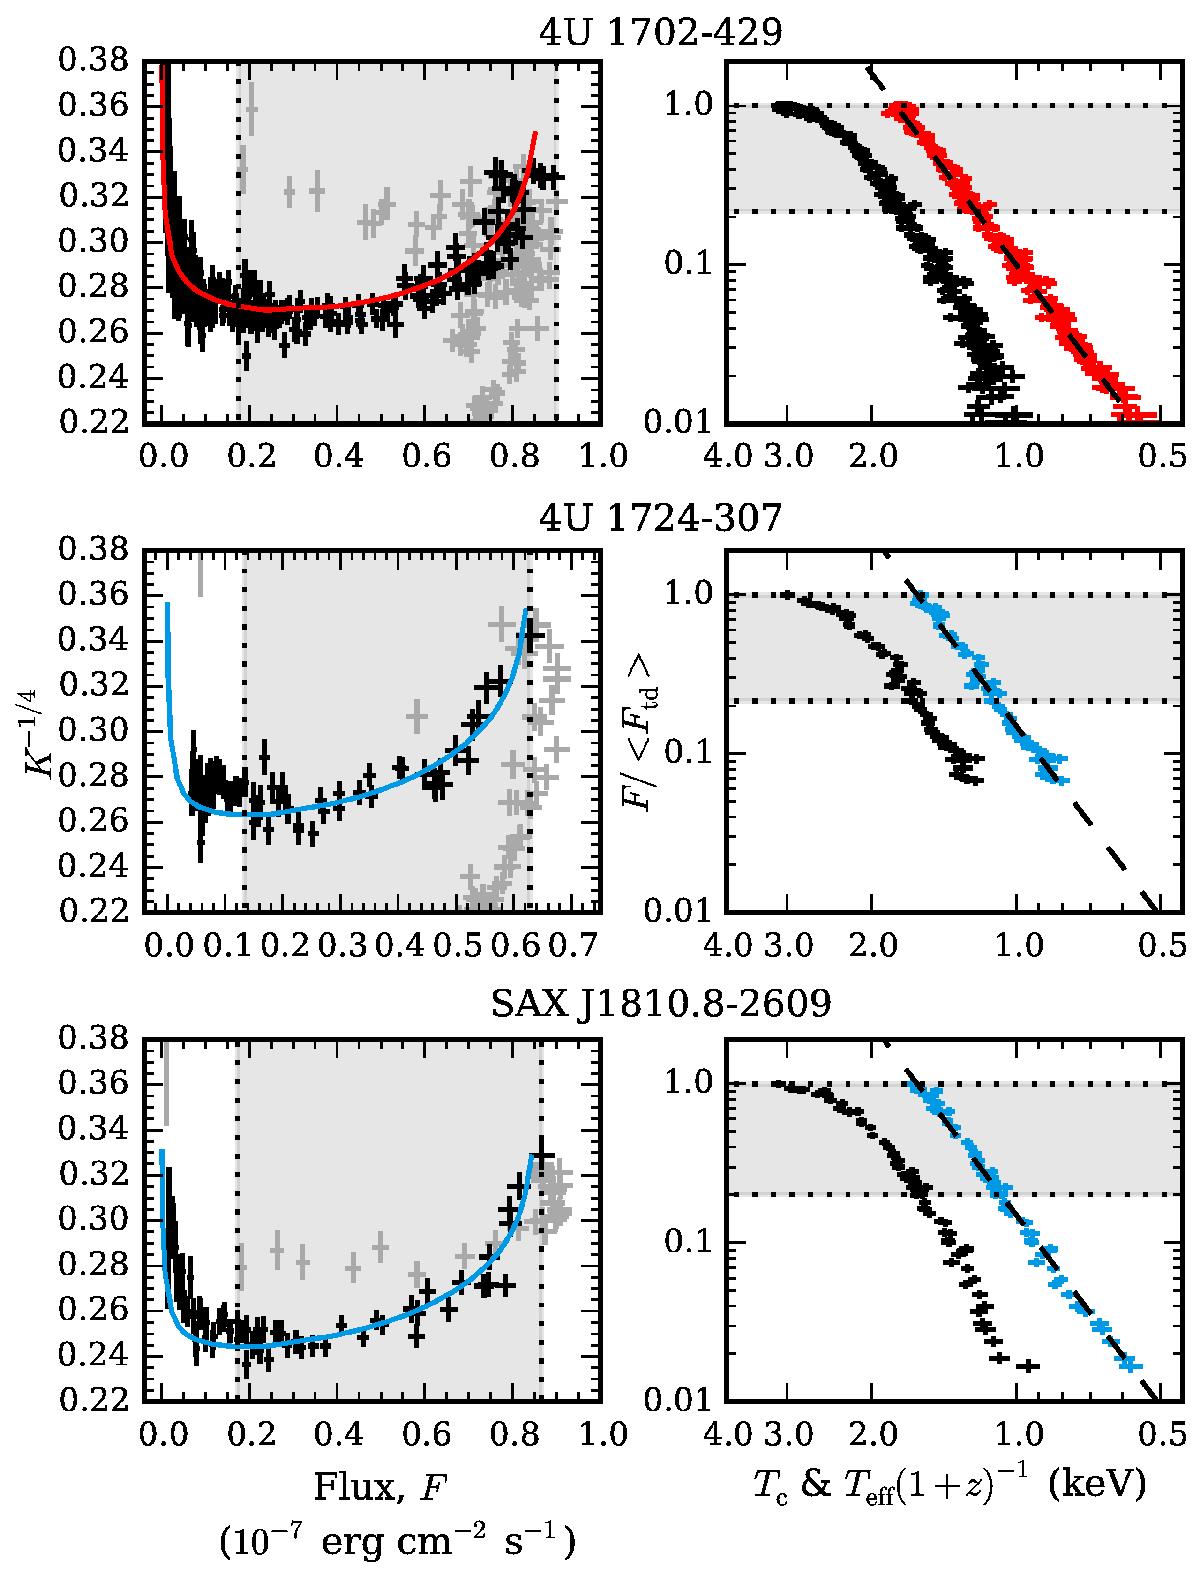
Left panel: combined cooling tail in the F ∝ L/LEdd vs. K− 1 / 4 ∝ fc plane with 1σ error limits presented by crosses. Gray crosses show the burst evolution before the touchdown. Best-fit theoretical atmosphere models are shown by blue (SolA001) or red (He) curves. Right panel: temperature evolution of the bursts. Blackbody color temperature Tc is shown for each cooling tail with black crosses. Red (He) or blue (SolA001) crosses show the color-corrected temperatures Teff(1 + z)-1. Dashed lines show a powerlaw with an index of 4 corresponding to the F ∝ T4 relation. Highlighted gray area marks the region of the cooling tail used in the fitting procedures.
Current usage metrics show cumulative count of Article Views (full-text article views including HTML views, PDF and ePub downloads, according to the available data) and Abstracts Views on Vision4Press platform.
Data correspond to usage on the plateform after 2015. The current usage metrics is available 48-96 hours after online publication and is updated daily on week days.
Initial download of the metrics may take a while.