Fig. A.1
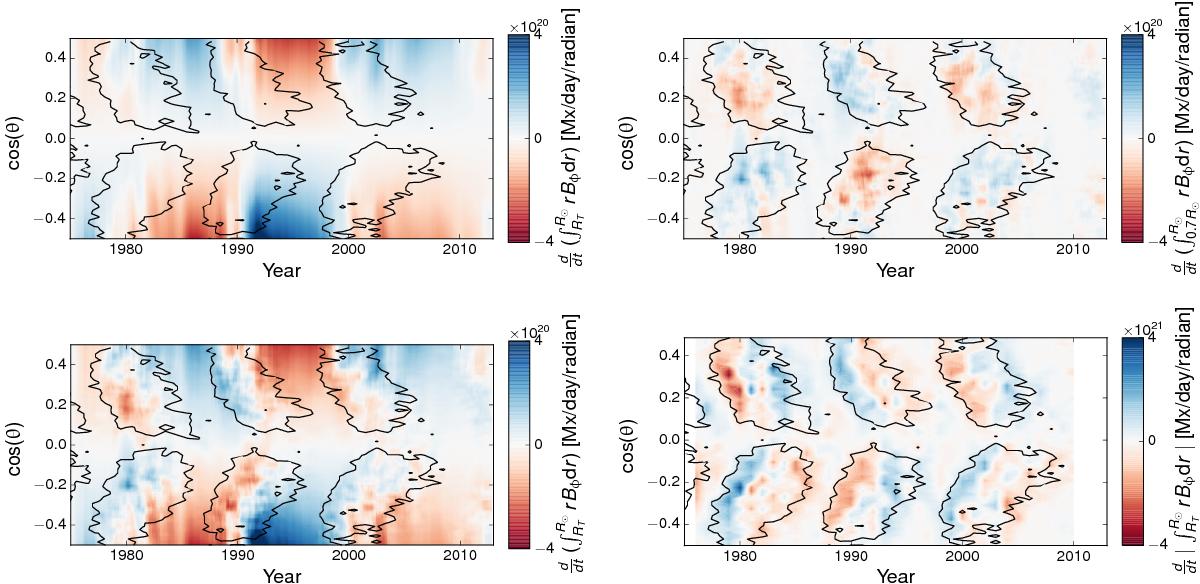
Generation rate of radially integrated toroidal magnetic flux as a function of time and latitude based on KPNO/VTT and SOLIS synoptic magnetograms. Upper left: flux generation by latitudinal shear. Upper right: flux generation by radial shear. Lower left: flux generation by latitudinal and radial shear combined. Lower right: change of integrated toroidal flux estimated from the sunspot emergence rate. We note the different scaling for the color bar of this plot. Black contours outline the region where sunspots were observed to emerge.
Current usage metrics show cumulative count of Article Views (full-text article views including HTML views, PDF and ePub downloads, according to the available data) and Abstracts Views on Vision4Press platform.
Data correspond to usage on the plateform after 2015. The current usage metrics is available 48-96 hours after online publication and is updated daily on week days.
Initial download of the metrics may take a while.