Free Access
Fig. 7
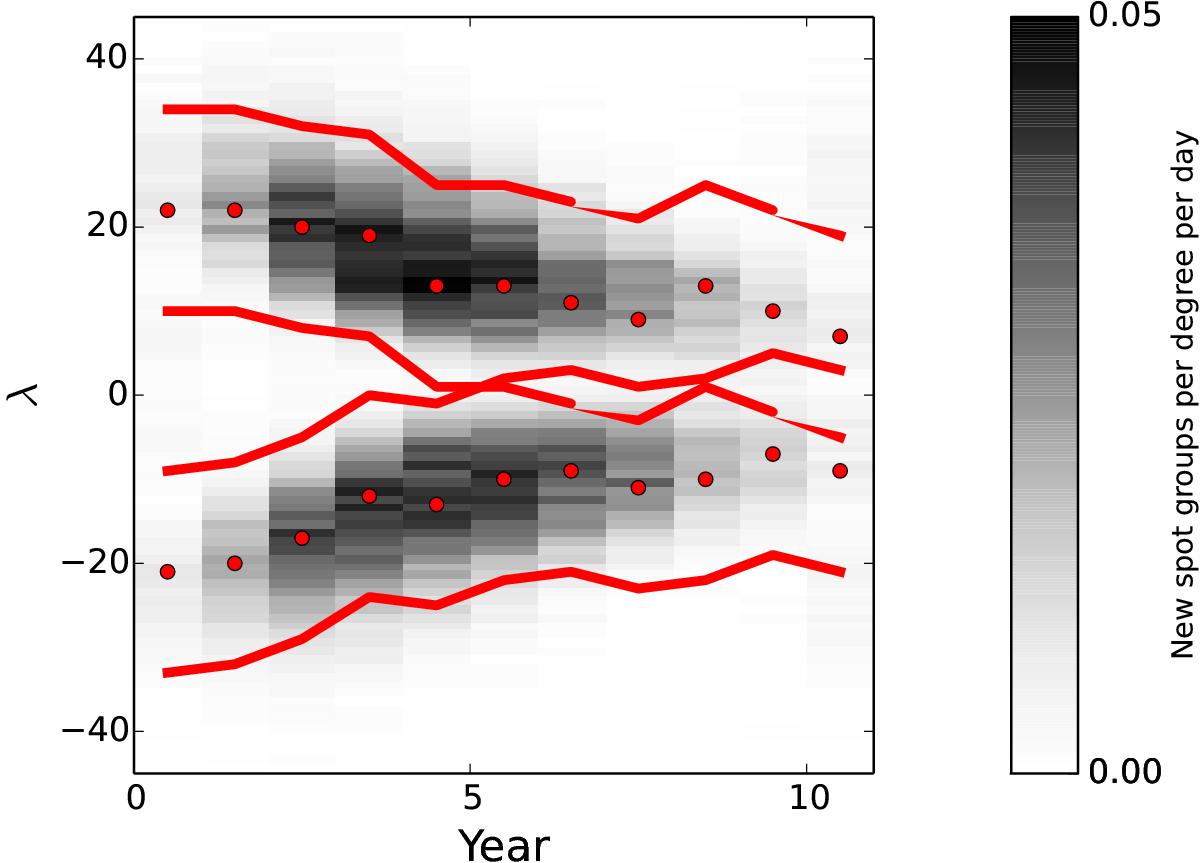
Average activity belts based on aligning the butterfly wings shown in Fig. 1. The alignment was based on the year in which the average latitude of the wings is closest to 15 degrees. The red dots show the latitudes at which the activity belts are centered each year, and the red lines show the central latitude ± 12°.
Current usage metrics show cumulative count of Article Views (full-text article views including HTML views, PDF and ePub downloads, according to the available data) and Abstracts Views on Vision4Press platform.
Data correspond to usage on the plateform after 2015. The current usage metrics is available 48-96 hours after online publication and is updated daily on week days.
Initial download of the metrics may take a while.