Fig. 5
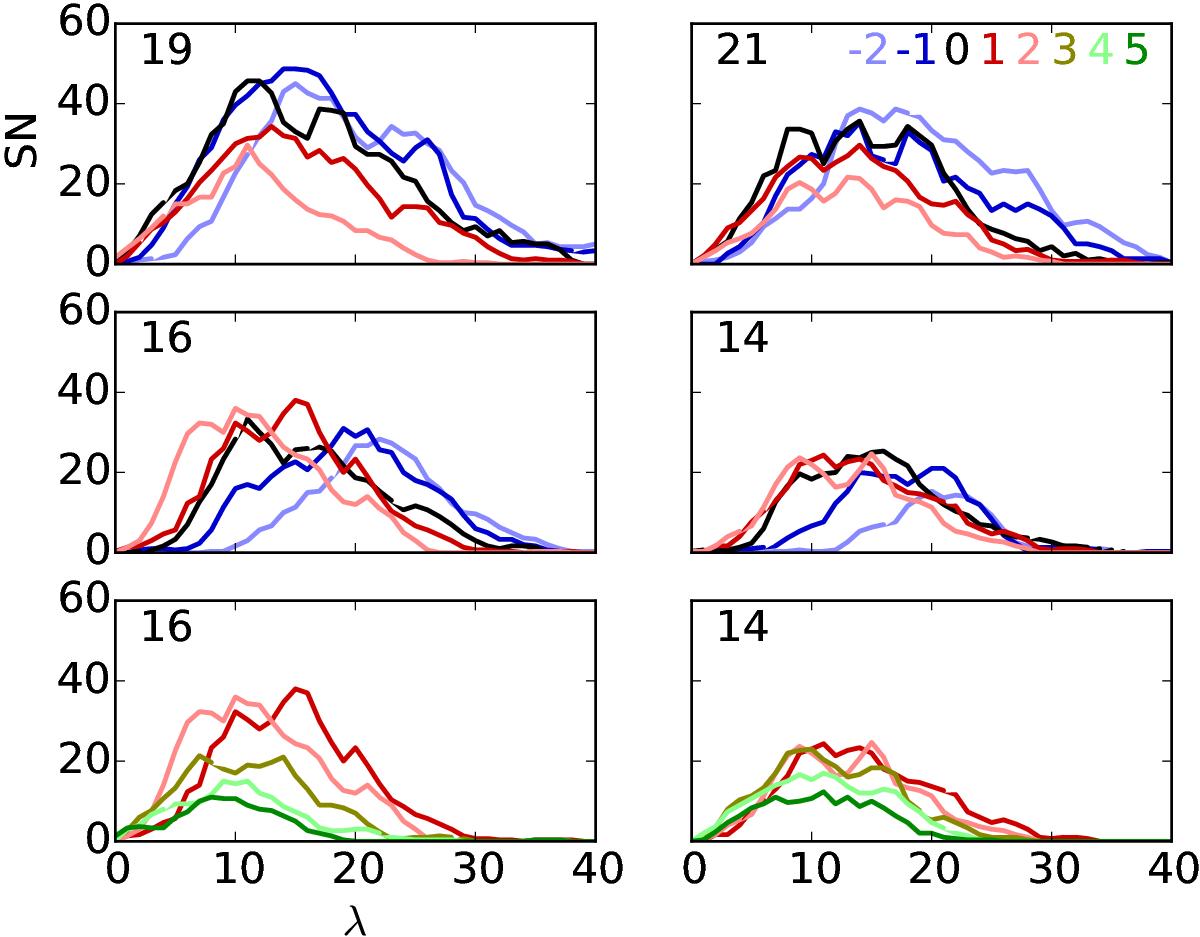
Latitudinal distribution of sunspots for several years during cycles 19 (upper left), 21 (upper right), 16 (middle and lower left), and 14 (middle and lower right). The black curves are for the years when the mean latitude of the sunspots was between 13° and 15°. The colors of the other curves indicate the year relative to this reference year (see legend in the top right panel). The curves were smoothed with a 3 degree boxcar filter. The late phases of cycles 14 and 16 are shown separately (bottom panels) to avoid overcrowding of lines.
Current usage metrics show cumulative count of Article Views (full-text article views including HTML views, PDF and ePub downloads, according to the available data) and Abstracts Views on Vision4Press platform.
Data correspond to usage on the plateform after 2015. The current usage metrics is available 48-96 hours after online publication and is updated daily on week days.
Initial download of the metrics may take a while.