Fig. 3
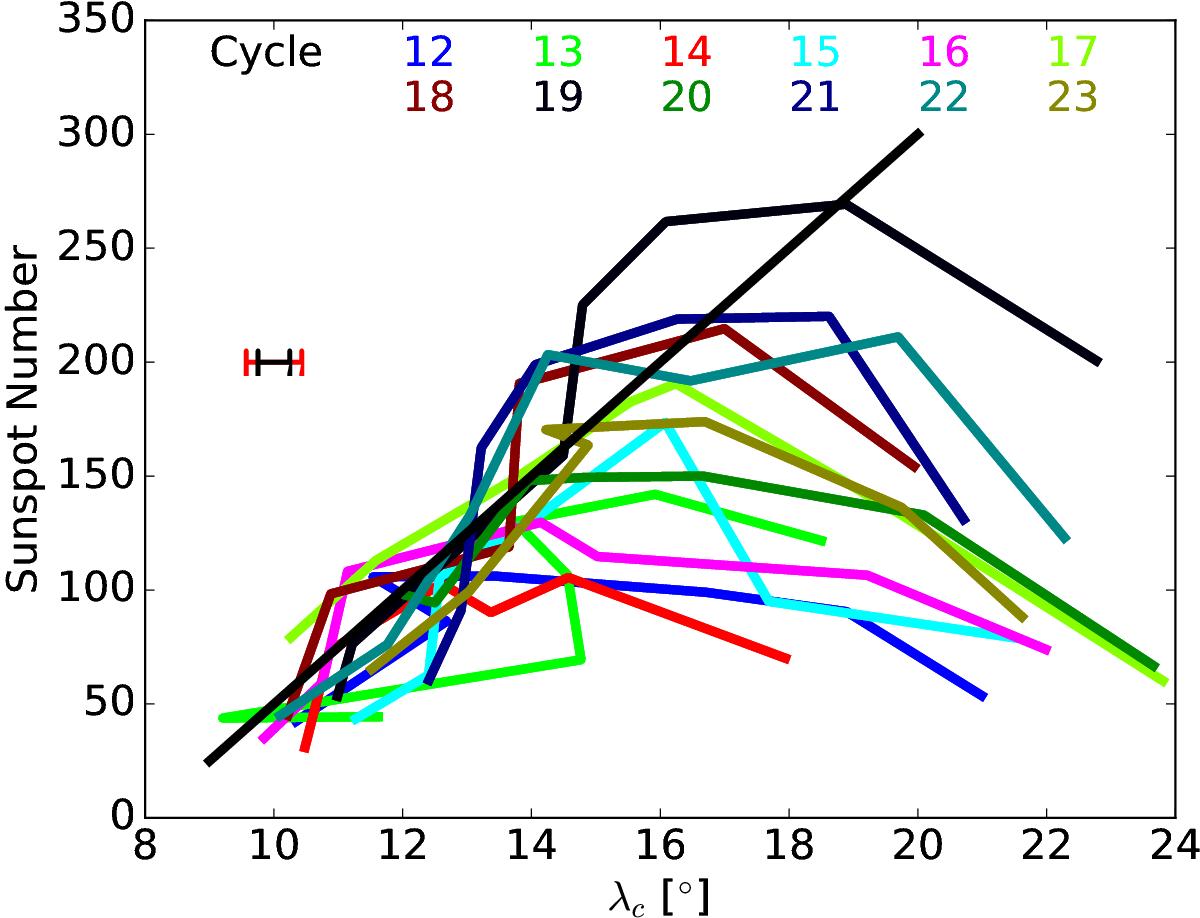
Yearly International Sunspot Number S1 for cycles 12 to 23 as a function of the mean unsigned latitude of the sunspots each year. The line colors indicate the different cycles. The thin black curve is an approximate fit to the declining phase: S = 25λc−200. Error bars on the left side indicate standard deviations of λc from the Gaussian fitting procedure carried out for each year; the maximum value is shown in red while the mean over all years is given in black.
Current usage metrics show cumulative count of Article Views (full-text article views including HTML views, PDF and ePub downloads, according to the available data) and Abstracts Views on Vision4Press platform.
Data correspond to usage on the plateform after 2015. The current usage metrics is available 48-96 hours after online publication and is updated daily on week days.
Initial download of the metrics may take a while.