Fig. 4
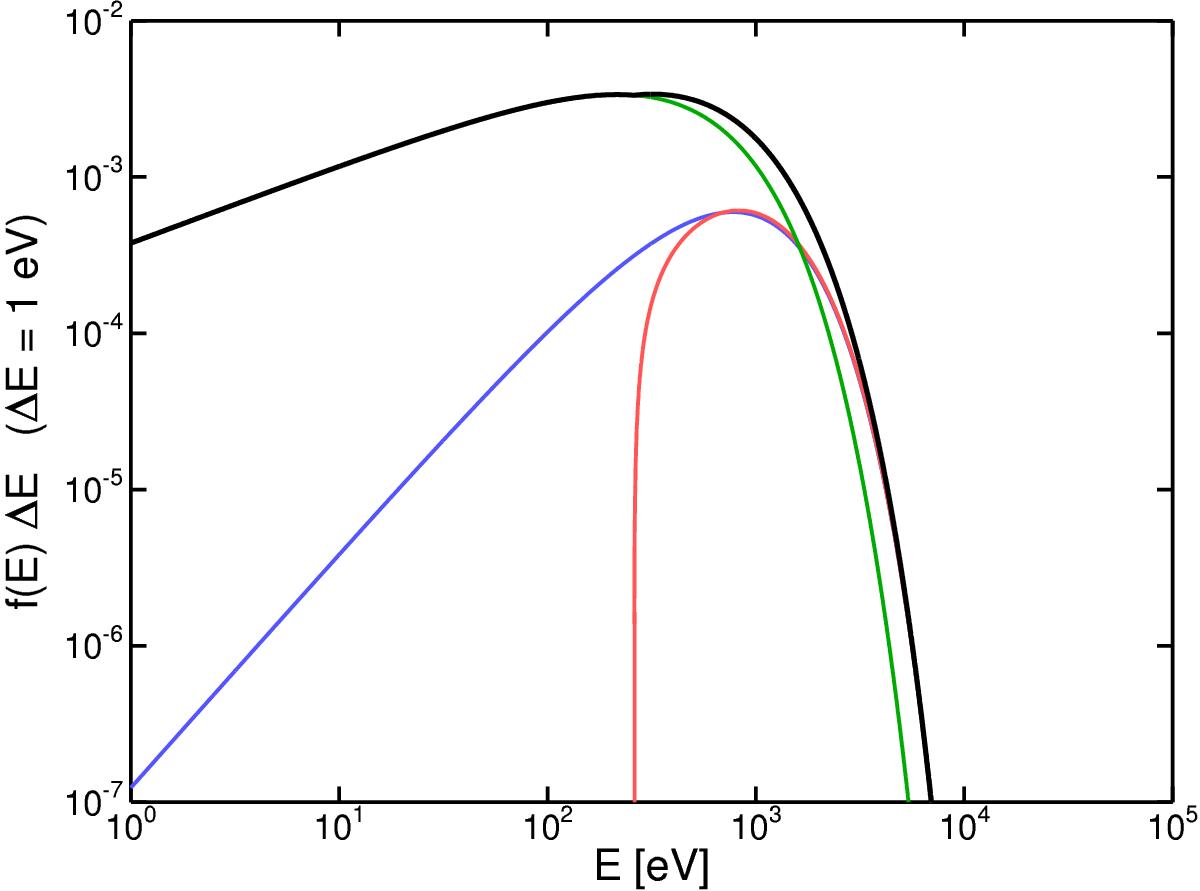
Comparison of distribution functions: the n-function with n = 3 is indicated by the blue line, the distribution function of reflected electrons (ΔΦ = 0) by the red line, the seed (Maxwellian) distribution function for reflected electrons by the green line, and the total upstream distribution, i.e. the sum of the reflected electrons and the seed particles, by the black line. The blue and red lines are identical to the ones in Fig. 1.
Current usage metrics show cumulative count of Article Views (full-text article views including HTML views, PDF and ePub downloads, according to the available data) and Abstracts Views on Vision4Press platform.
Data correspond to usage on the plateform after 2015. The current usage metrics is available 48-96 hours after online publication and is updated daily on week days.
Initial download of the metrics may take a while.