Fig. 7
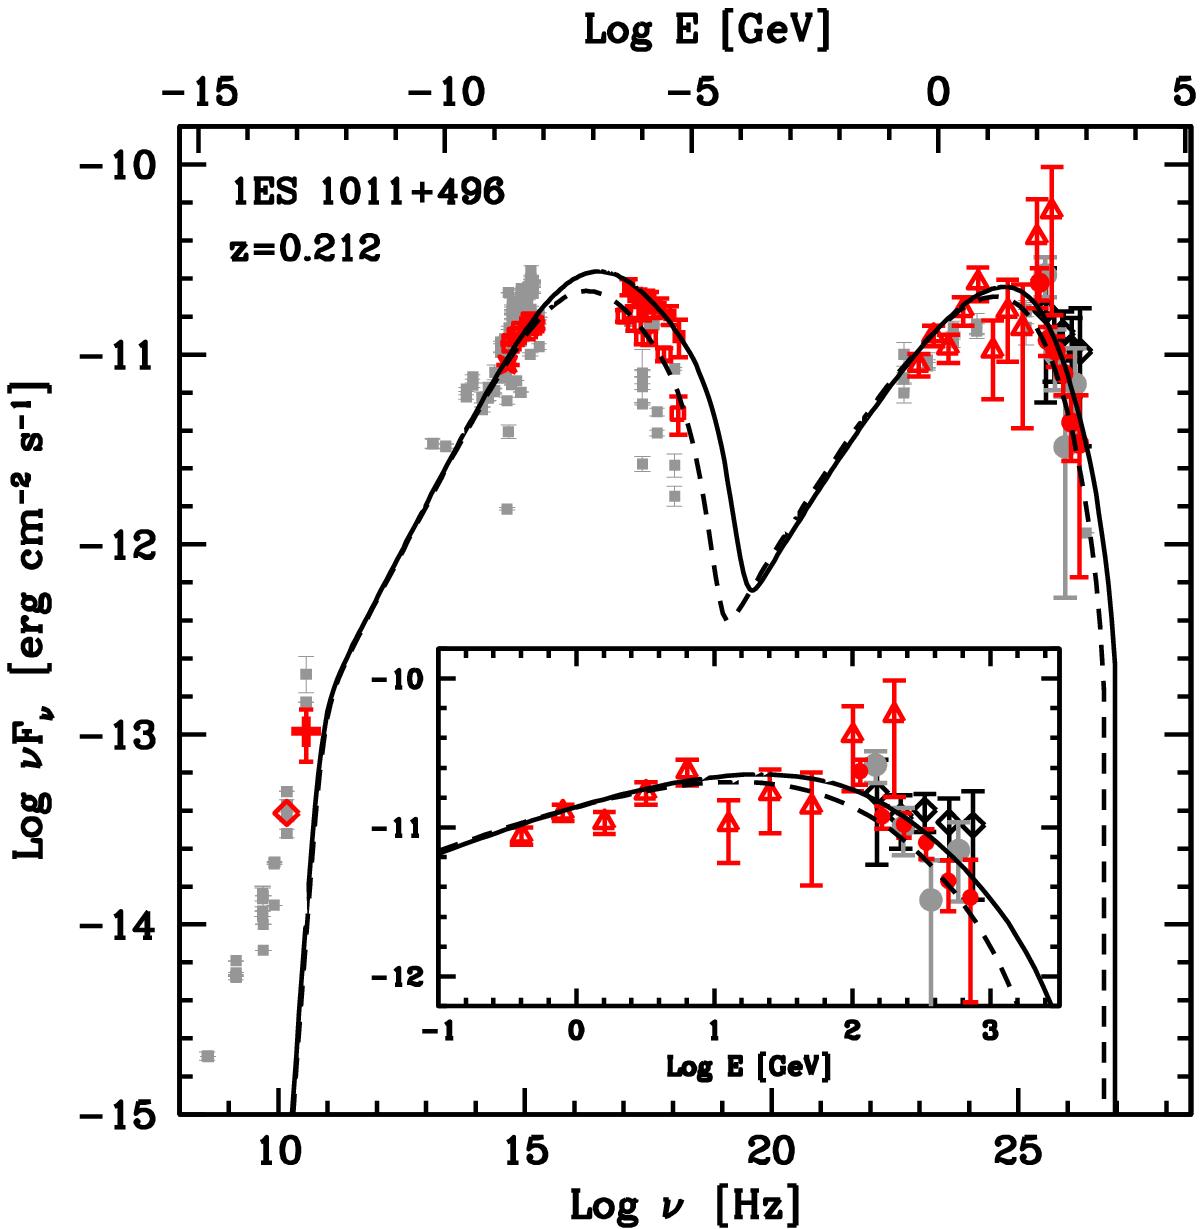
Averaged SED of 1ES 1011+496 compiled from simultaneous 2011 and 2012 MWL observations marked in red. We combine deabsorbed (Domínguez et al. 2011) VHE γ-ray observations (circles) by MAGIC and HE γ-ray data (triangles) from Fermi-LAT; Swift data from 2012 March 27 (filled squares) and 31 (open squares) in X-rays and UVOT bands (squares), the latter corrected for Galactic extinction (Fitzpatrick 1999); optical data in the R-band (star) from KVA (corrected for host galaxy contribution; Nilsson et al. 2007) and radio data at 15 GHz (diamond) and 37 GHz (cross) provided by the OVRO and Metsähovi telescopes. The solid (dashed) line represents the fit with a one-zone SSC model considering the X-ray spectrum from March 27 (March 31). The parameters are listed in Table 4. Previous MAGIC observations carried out in 2007 (black diamonds; Albert et al. 2007a) and 2008 (gray circles; Ahnen et al. 2015) are corrected for EBL absorption according to the model by Domínguez et al. (2011). The inset is a zoom into the HE to VHE γ-ray band. Archival data (gray squares) are taken from the ASDC20.
Current usage metrics show cumulative count of Article Views (full-text article views including HTML views, PDF and ePub downloads, according to the available data) and Abstracts Views on Vision4Press platform.
Data correspond to usage on the plateform after 2015. The current usage metrics is available 48-96 hours after online publication and is updated daily on week days.
Initial download of the metrics may take a while.