Fig. 3
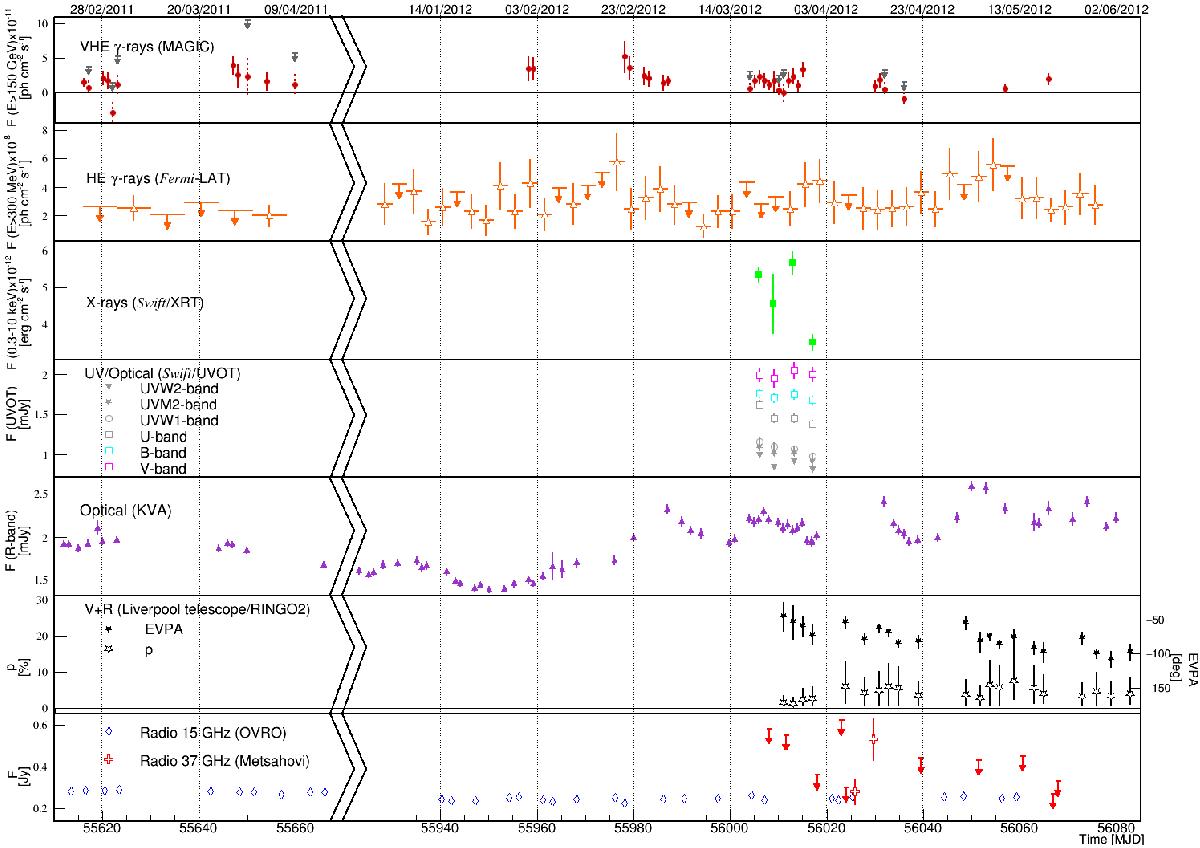
Stitched 2011 and 2012 MWL light curve of 1ES 1011+496 zoomed into the observation periods from February to April and from January to May. From top to bottom: VHE γ-ray (red circles) and HE γ-ray (orange triangles) data by MAGIC and by Fermi-LAT, observations in X-rays (green squares), UV (gray triangles, stars and circles) and optical U, B and V-bands (gray, cyan and magenta squares) by Swift (XRT and UVOT), in the optical R-band (purple triangles) by the KVA telescope (host galaxy subtracted; Nilsson et al. 2007), optical polarimetry data taken with V + R-filter by the Liverpool telescope (RINGO2) and radio data provided by the OVRO (blue diamonds) and the Metsähovi telescopes (red crosses). Upper limits of 95% confidence level are indicated by downward arrows (see text for details). The light curves are daily binned except HE γ-rays, where a seven and three day binning was applied to the 2011 and 2012 data, respectively. The time axis between 2011 and 2012 observation is discontinuous.
Current usage metrics show cumulative count of Article Views (full-text article views including HTML views, PDF and ePub downloads, according to the available data) and Abstracts Views on Vision4Press platform.
Data correspond to usage on the plateform after 2015. The current usage metrics is available 48-96 hours after online publication and is updated daily on week days.
Initial download of the metrics may take a while.