Fig. 8
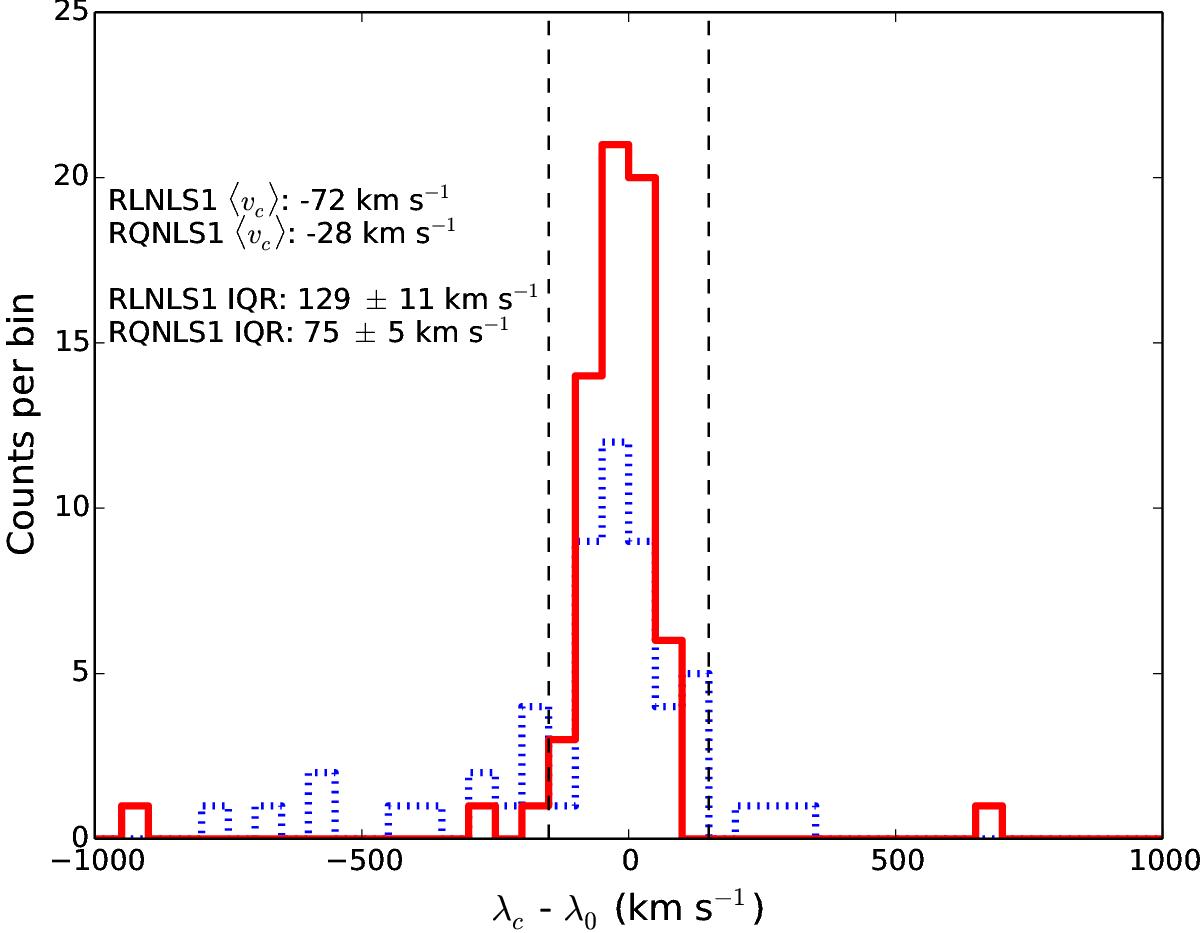
Histogram of the peak position of the λ5007 line in the two samples with respect to [O II]. Binning of 50 km s-1. The dashed vertical lines are the limits of 150 km s-1 for blue and red outliers. The red solid line indicates the RQNLS1s sample; the blue dotted line indicates the RLNLS1s sample. The values are the IQR, average shift, and standard deviation, all in km s-1.
Current usage metrics show cumulative count of Article Views (full-text article views including HTML views, PDF and ePub downloads, according to the available data) and Abstracts Views on Vision4Press platform.
Data correspond to usage on the plateform after 2015. The current usage metrics is available 48-96 hours after online publication and is updated daily on week days.
Initial download of the metrics may take a while.