Fig. 5
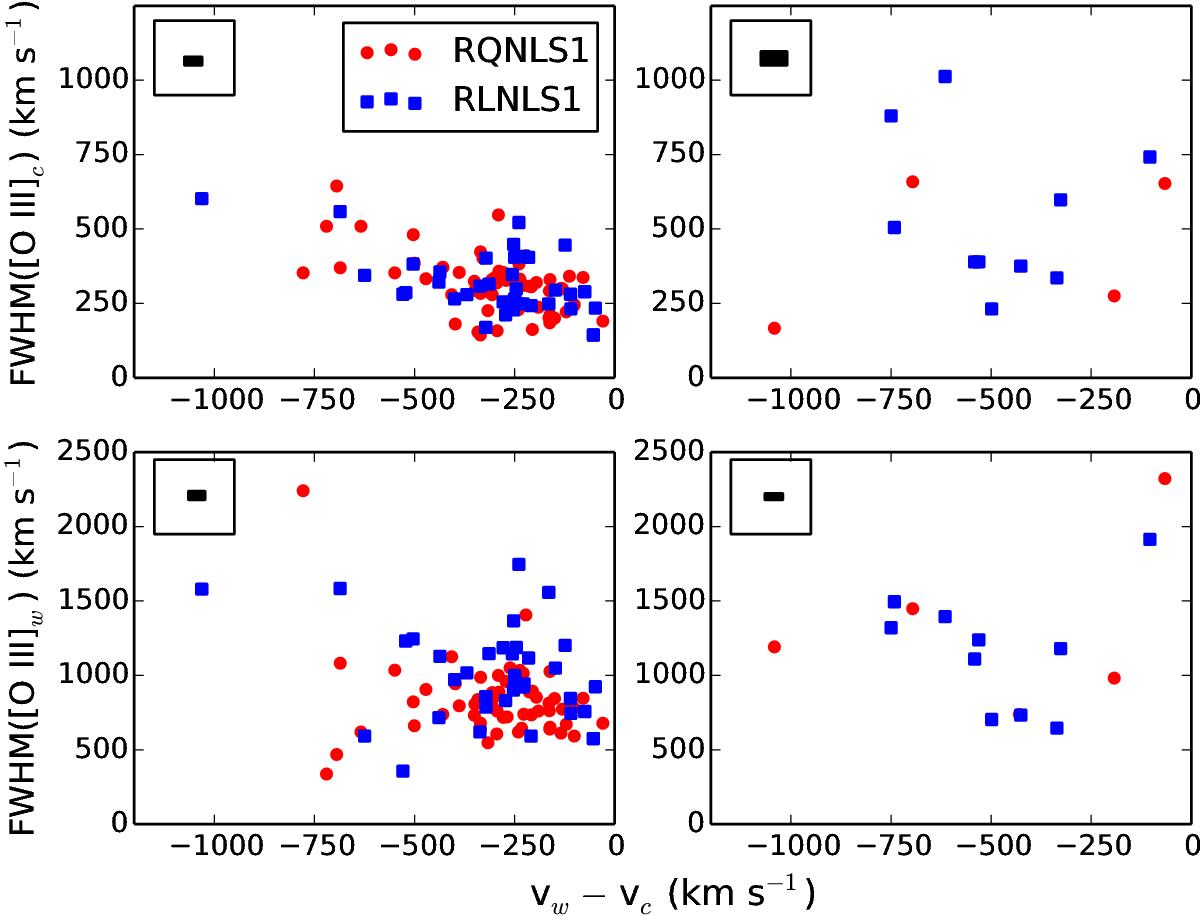
Top panels: velocity of the wing against FWHM of the core component for both samples, regular sources in the left and outliers in the right. Bottom panels: velocity of the wing against FWHM of the wing for both samples, as before. RQNLS1s are indicated by red circles, RLNLS1s are indicated by blue squares. The black filled rectangles represented in the boxes at the upper left corner of each diagram illustrate the size of the average uncertainty range of our measurements.
Current usage metrics show cumulative count of Article Views (full-text article views including HTML views, PDF and ePub downloads, according to the available data) and Abstracts Views on Vision4Press platform.
Data correspond to usage on the plateform after 2015. The current usage metrics is available 48-96 hours after online publication and is updated daily on week days.
Initial download of the metrics may take a while.