Fig. 3
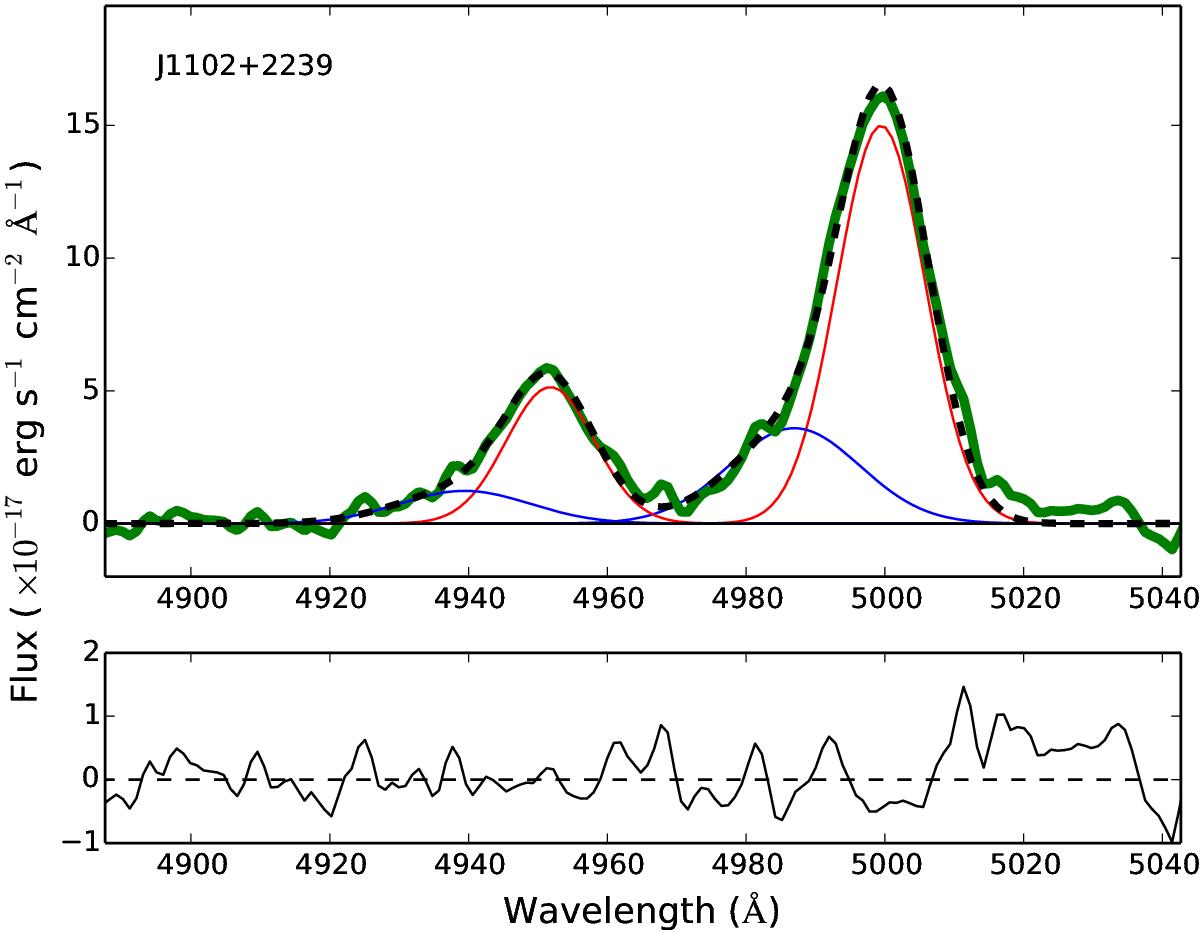
[O III] lines fitting with the automatic procedure in J1102+2239. Top panel: the thick green line is the original spectrum, continuum and Fe II subtracted. The blue and red solid lines represent the blue wing and core component, respectively. The black dashed line is the sum of the resulting fit. Bottom panel: residuals of the fitting procedure.
Current usage metrics show cumulative count of Article Views (full-text article views including HTML views, PDF and ePub downloads, according to the available data) and Abstracts Views on Vision4Press platform.
Data correspond to usage on the plateform after 2015. The current usage metrics is available 48-96 hours after online publication and is updated daily on week days.
Initial download of the metrics may take a while.