Free Access
Fig. 10
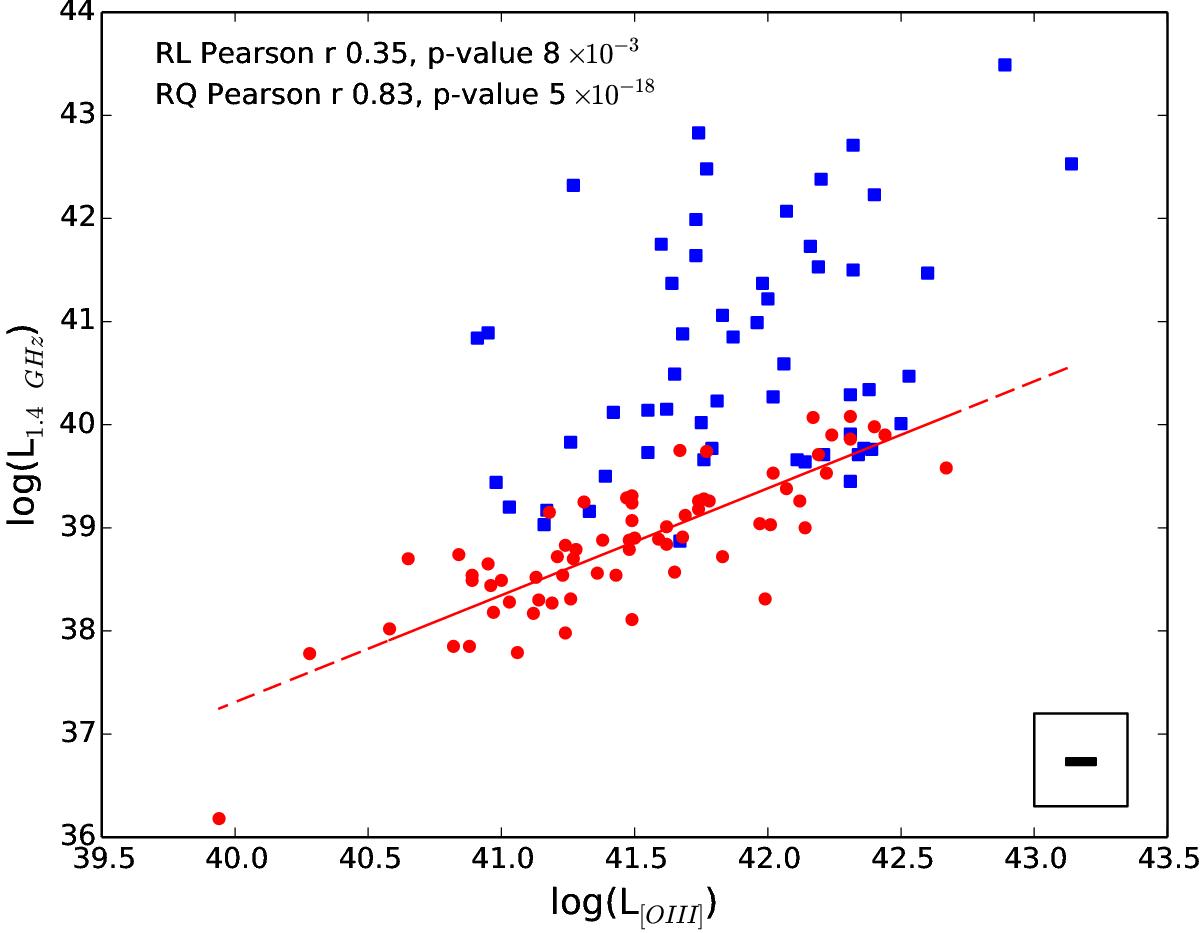
[O III] luminosity vs. radio luminosity at 1.4 GHz. The solid red line indicates the best fit for RQNLS1s. Correlation coefficients for both samples are also shown. Black filled rectangles as in Fig. 5.
Current usage metrics show cumulative count of Article Views (full-text article views including HTML views, PDF and ePub downloads, according to the available data) and Abstracts Views on Vision4Press platform.
Data correspond to usage on the plateform after 2015. The current usage metrics is available 48-96 hours after online publication and is updated daily on week days.
Initial download of the metrics may take a while.