Fig. 1
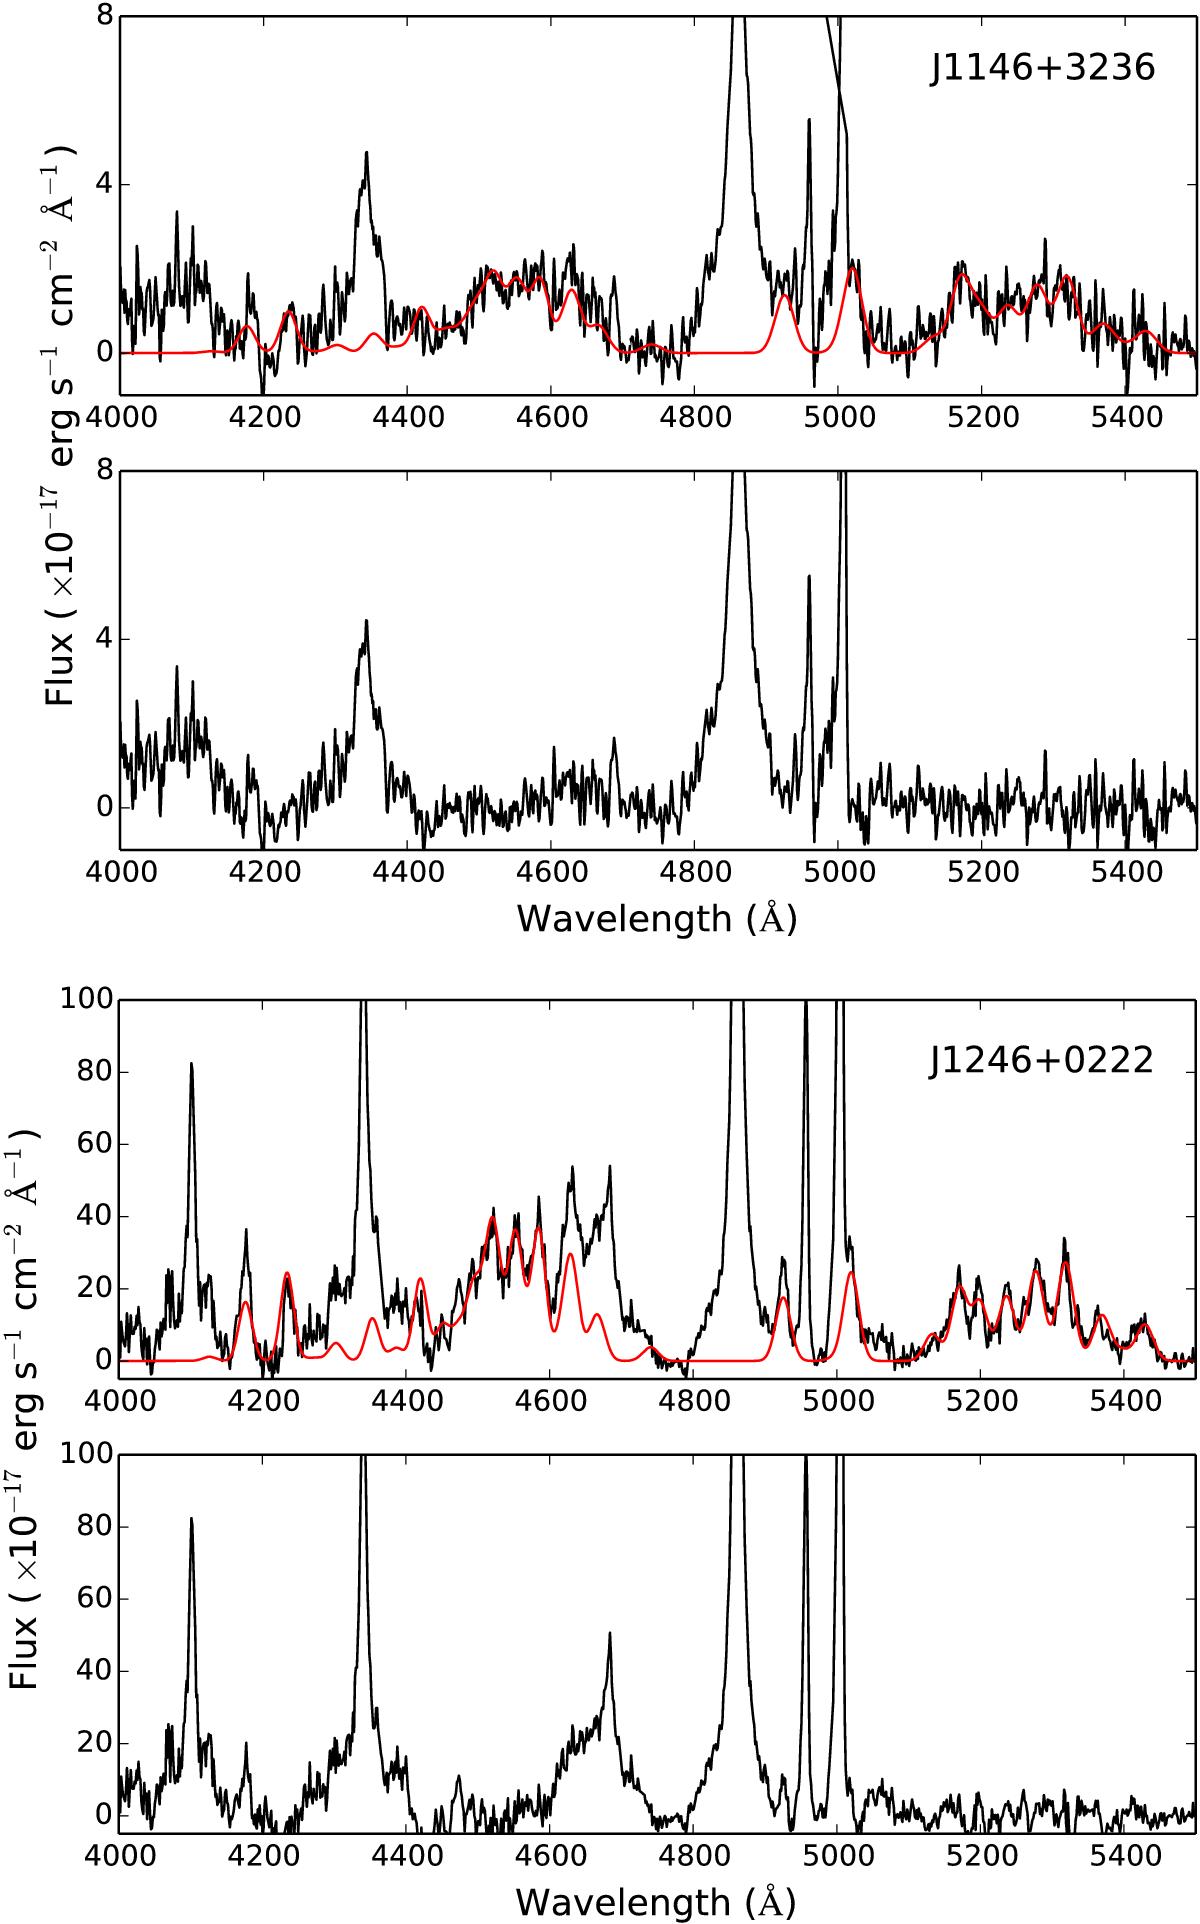
Hβ region of J1146+3236 (top 2 panels) and J1246+0222 (bottom 2 panels). The spectra have a S/N ratio of 10 and 40 in the 5100 Å continuum, respectively. In the first panel of each source the black solid line indicates the spectrum corrected for Galactic absorption, redshift and continuum subtracted; the red solid line indicates the Fe II template. In the second panel of each source the black solid line shows the spectrum with Fe II subtracted.
Current usage metrics show cumulative count of Article Views (full-text article views including HTML views, PDF and ePub downloads, according to the available data) and Abstracts Views on Vision4Press platform.
Data correspond to usage on the plateform after 2015. The current usage metrics is available 48-96 hours after online publication and is updated daily on week days.
Initial download of the metrics may take a while.