Fig. 3
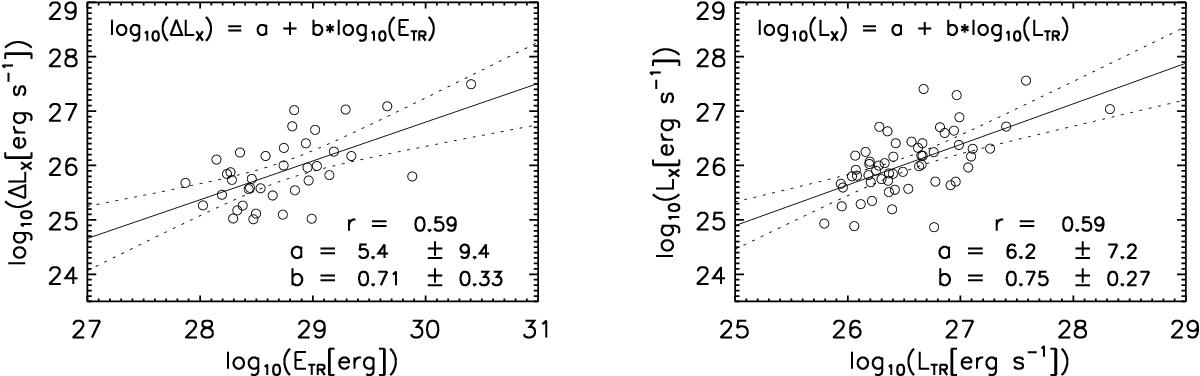
Soft X-ray vs. UV flare relationships. Left: total transition region emission ETR observed during the UVCS exposures corresponding to the peak O vi emission (i.e., LTR times the exposure time), plotted against the variation in GOES X-ray luminosity ΔLX between the UVCS exposures corresponding to the peak O vi emission and the following exposure. Right: transition region luminosity LTR during the peak UVCS exposure plotted against the GOES X-ray luminosity LX at the peak of the LTR. Also shown are the least-square linear fits to the log-log data (solid line), i.e., the best fit power-law regressions, together with the respective 95% confidence intervals (dotted lines).
Current usage metrics show cumulative count of Article Views (full-text article views including HTML views, PDF and ePub downloads, according to the available data) and Abstracts Views on Vision4Press platform.
Data correspond to usage on the plateform after 2015. The current usage metrics is available 48-96 hours after online publication and is updated daily on week days.
Initial download of the metrics may take a while.