Fig. 1
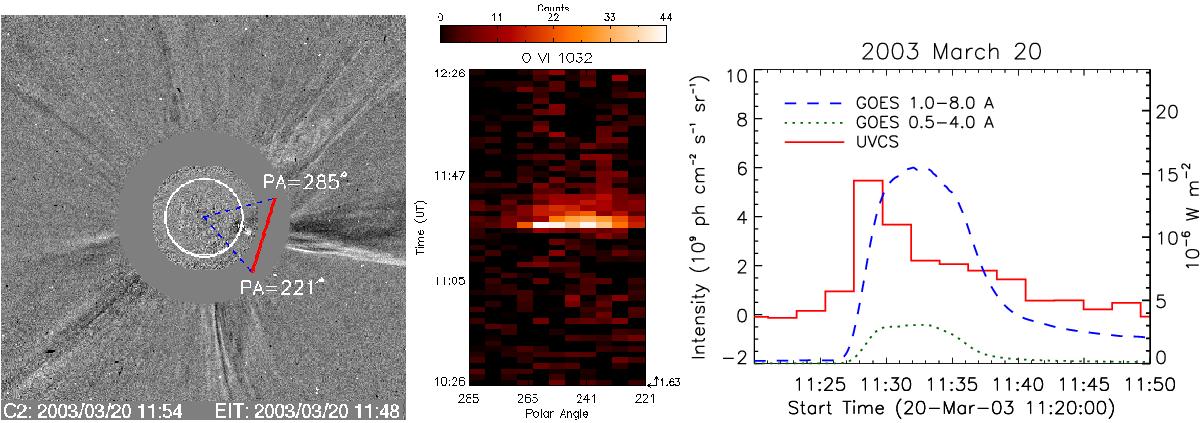
Left: LASCO and EIT difference images at the time of the GOES M1.5 class flare of 2003 March 20 with the UVCS slit position superimposed. Middle: Brightness of the O vi 1032 line as a function of spatial position along the slit (horizontal direction) and time (vertical direction). The pre-event background was subtracted. Right: O vi 1032 Å intensity after subtraction of the pre-event intensity (red histogram) plotted against time for the same event. The GOES soft X-ray flux is plotted as a blue dashed line. The GOES hard X-ray flux is shown with the green dotted line. The left-hand scale applies to O vi, and the right-hand scale to GOES.
Current usage metrics show cumulative count of Article Views (full-text article views including HTML views, PDF and ePub downloads, according to the available data) and Abstracts Views on Vision4Press platform.
Data correspond to usage on the plateform after 2015. The current usage metrics is available 48-96 hours after online publication and is updated daily on week days.
Initial download of the metrics may take a while.