Fig. 7
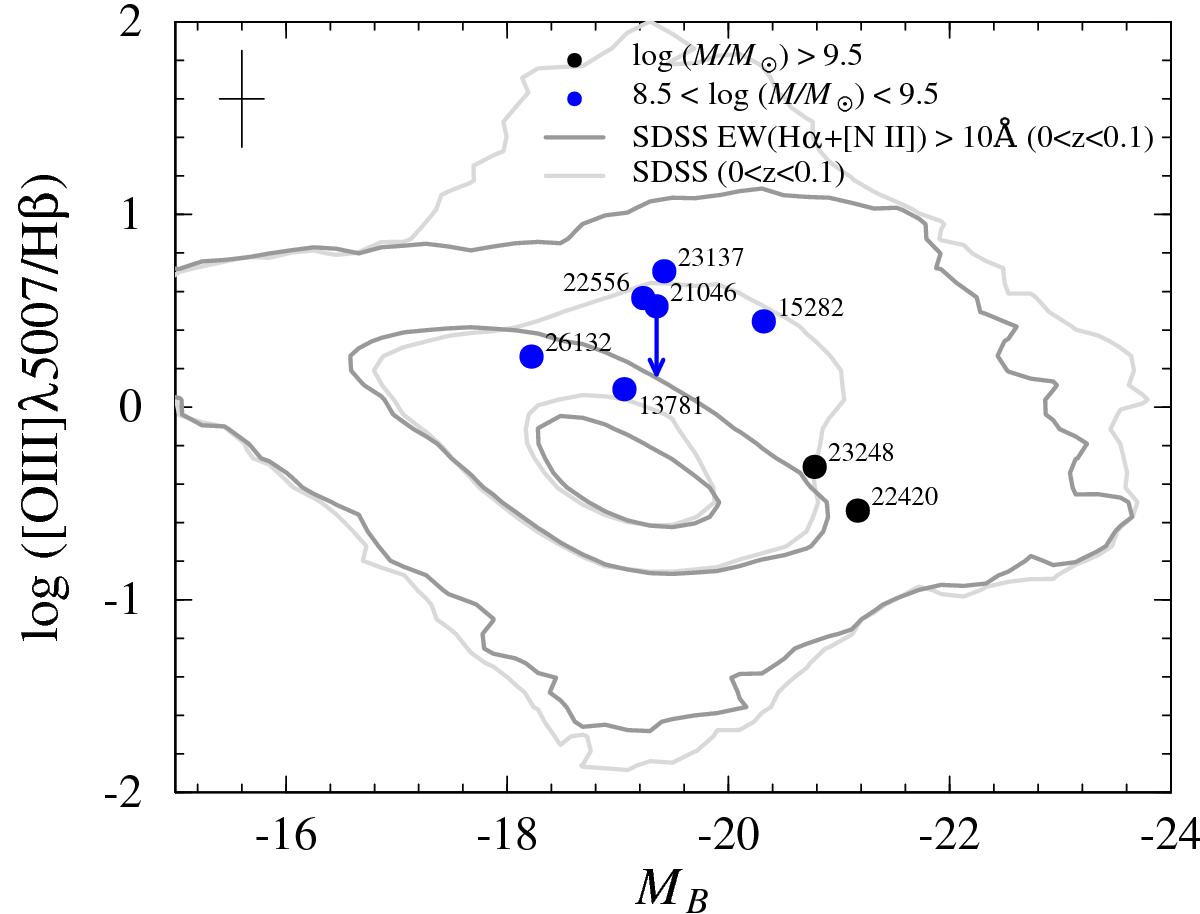
Excitation vs. rest-frame B-band absolute magnitude. The sample is represented as filled circles with the mass differentiation in different colours as indicated in the legend. The SDSS reference is shown as grey lines with the contours corresponding to 99%, 75%, and 25%. Average error bars are located in the upper left corner.
Current usage metrics show cumulative count of Article Views (full-text article views including HTML views, PDF and ePub downloads, according to the available data) and Abstracts Views on Vision4Press platform.
Data correspond to usage on the plateform after 2015. The current usage metrics is available 48-96 hours after online publication and is updated daily on week days.
Initial download of the metrics may take a while.