Fig. 1
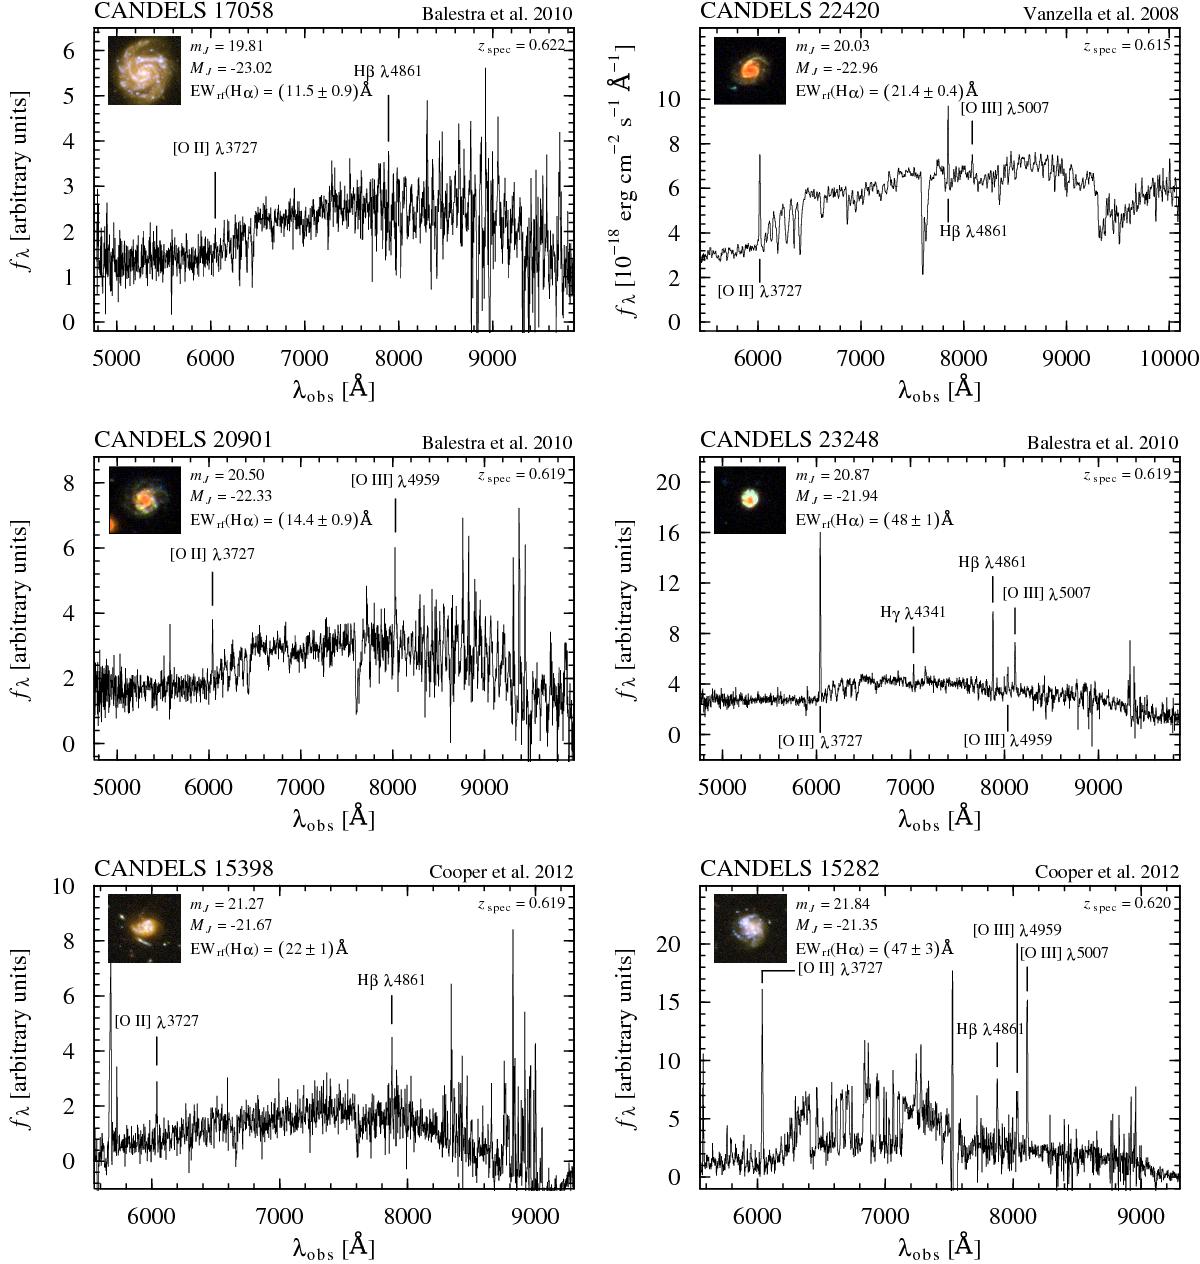
Spectra collected from the literature. Among the 46 objects selected in the raw sample, 12(26%) have a FITS optical spectrum available. Each spectrum shows the CANDELS ID and the reference on top; an RGB image built using ACS b, v, and z bands with north up, east left, and a size of 5′′× 5′′; the spec-z taken from the reference; observed J-band apparent magnitude; rest-frame J-band absolute magnitude; Hα rest-frame EW (observed EW is 1+z times the rest-frame value); and the identification of the emission lines that we can measure.
Current usage metrics show cumulative count of Article Views (full-text article views including HTML views, PDF and ePub downloads, according to the available data) and Abstracts Views on Vision4Press platform.
Data correspond to usage on the plateform after 2015. The current usage metrics is available 48-96 hours after online publication and is updated daily on week days.
Initial download of the metrics may take a while.