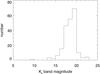
Fig. 3
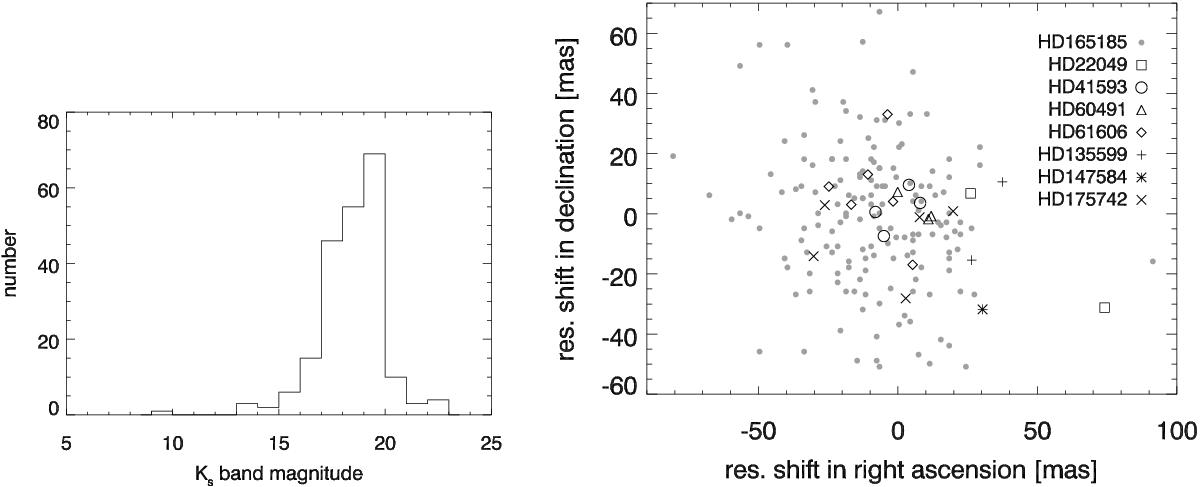
Left: Ks magnitude distribution of candidates. Based on Table D.1. Errors in magnitude are not considered. Right: residual motion of candidates. For all candidates detected in two epochs, the figure shows the residual shifts in right ascension and declination over the time elapsed between the epochs (Table D.1) after correcting for the proper and parallactic motion of the central stars (Table E.2). The symbols group the candidates according to their central stars. Error bars have been omitted for clarity.
Current usage metrics show cumulative count of Article Views (full-text article views including HTML views, PDF and ePub downloads, according to the available data) and Abstracts Views on Vision4Press platform.
Data correspond to usage on the plateform after 2015. The current usage metrics is available 48-96 hours after online publication and is updated daily on week days.
Initial download of the metrics may take a while.