Fig. E.4
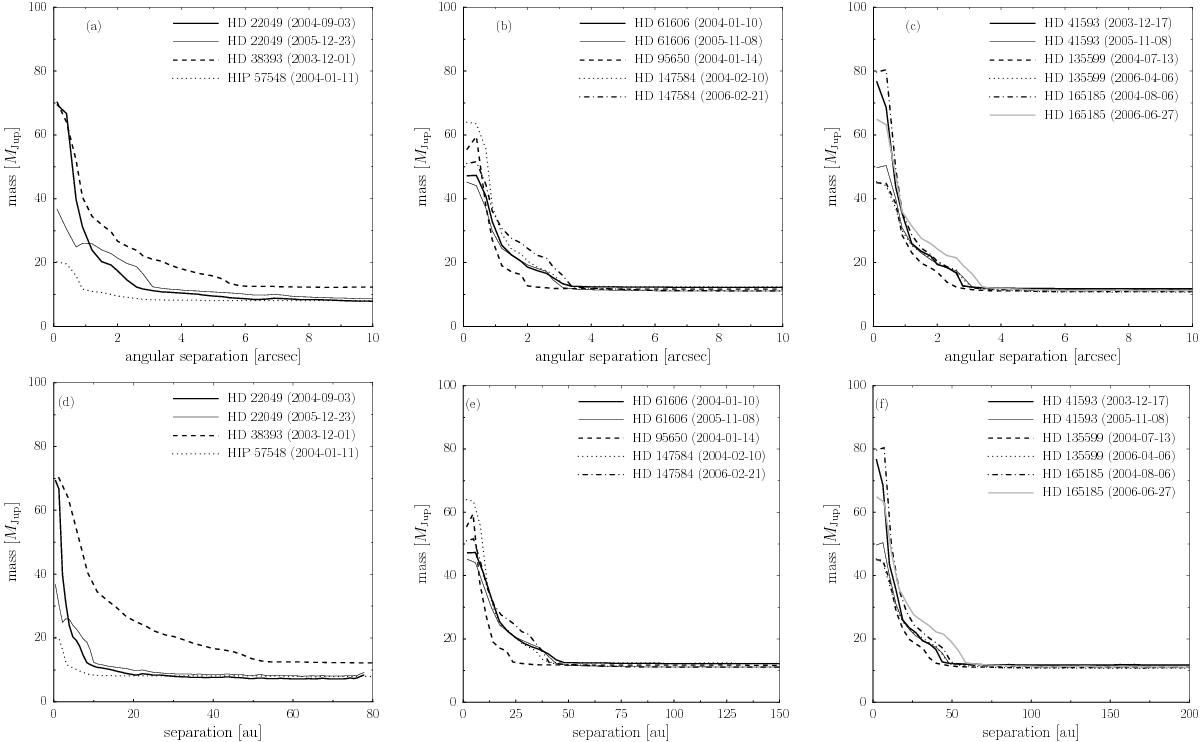
Top row: detection limits on mass as a function of angular separation. Bottom row: the same as a function of separation in linear scale. Based on the dynamic range curves presented in Figs. 2 and E.1–E.3 and on evolutionary models (DUSTY00 and COND03) assuming an age of 500 Myr. The layout follows Figs. E.3b–d.
Current usage metrics show cumulative count of Article Views (full-text article views including HTML views, PDF and ePub downloads, according to the available data) and Abstracts Views on Vision4Press platform.
Data correspond to usage on the plateform after 2015. The current usage metrics is available 48-96 hours after online publication and is updated daily on week days.
Initial download of the metrics may take a while.