Fig. E.1
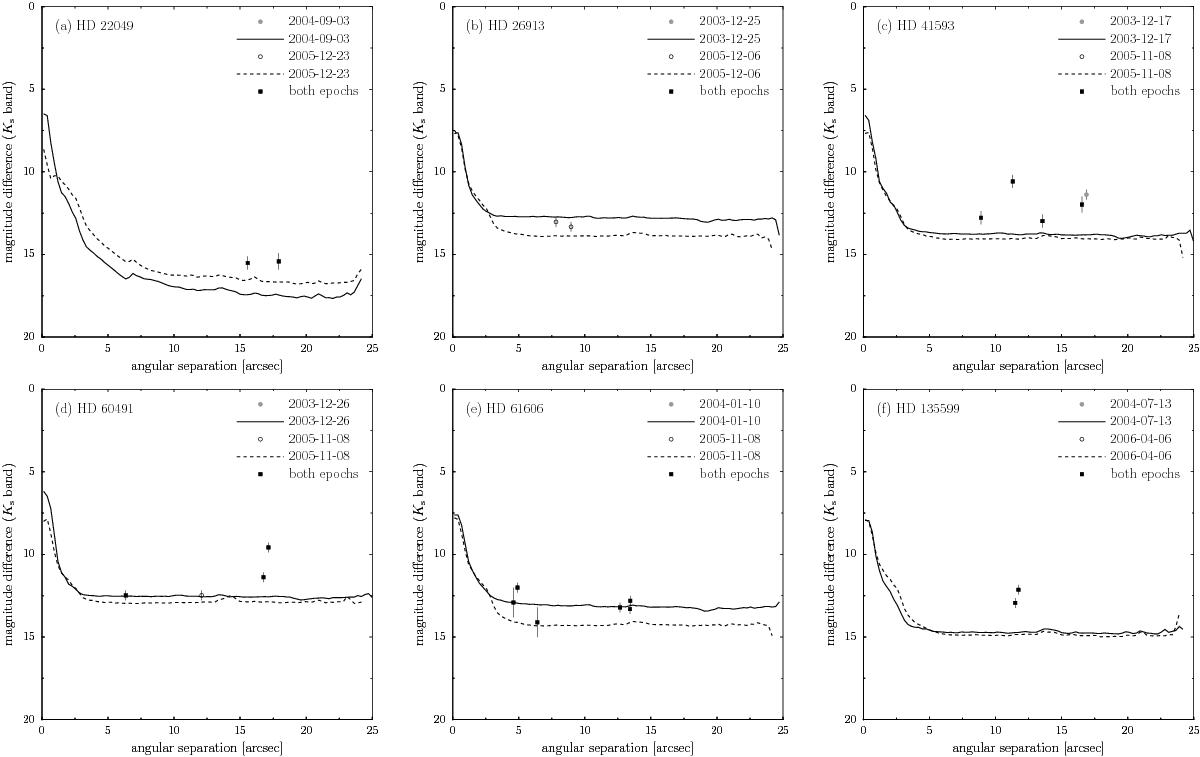
Dynamic range curves are shown for stars with candidates and observations in two epochs: HD 22049, HD 26913, HD 41593, HD 60491, HD 61606, and HD 135599. The lines show the 10σ detection limits for the 1st and 2nd epoch as is indicated in the legend. The adoption of a 5σ limit to describe the visual detection of candidates would lower the curves by 2.5 log 2 = 0.75 mag. Furthermore, the curves can vary by 0.3 mag due to the uncertainty of the transmission of the coronagraph. Filled circles indicate candidates found in the 1st epoch, open circles those in the 2nd epoch, and filled squares those seen in both epochs.
Current usage metrics show cumulative count of Article Views (full-text article views including HTML views, PDF and ePub downloads, according to the available data) and Abstracts Views on Vision4Press platform.
Data correspond to usage on the plateform after 2015. The current usage metrics is available 48-96 hours after online publication and is updated daily on week days.
Initial download of the metrics may take a while.