Free Access
Fig. 9
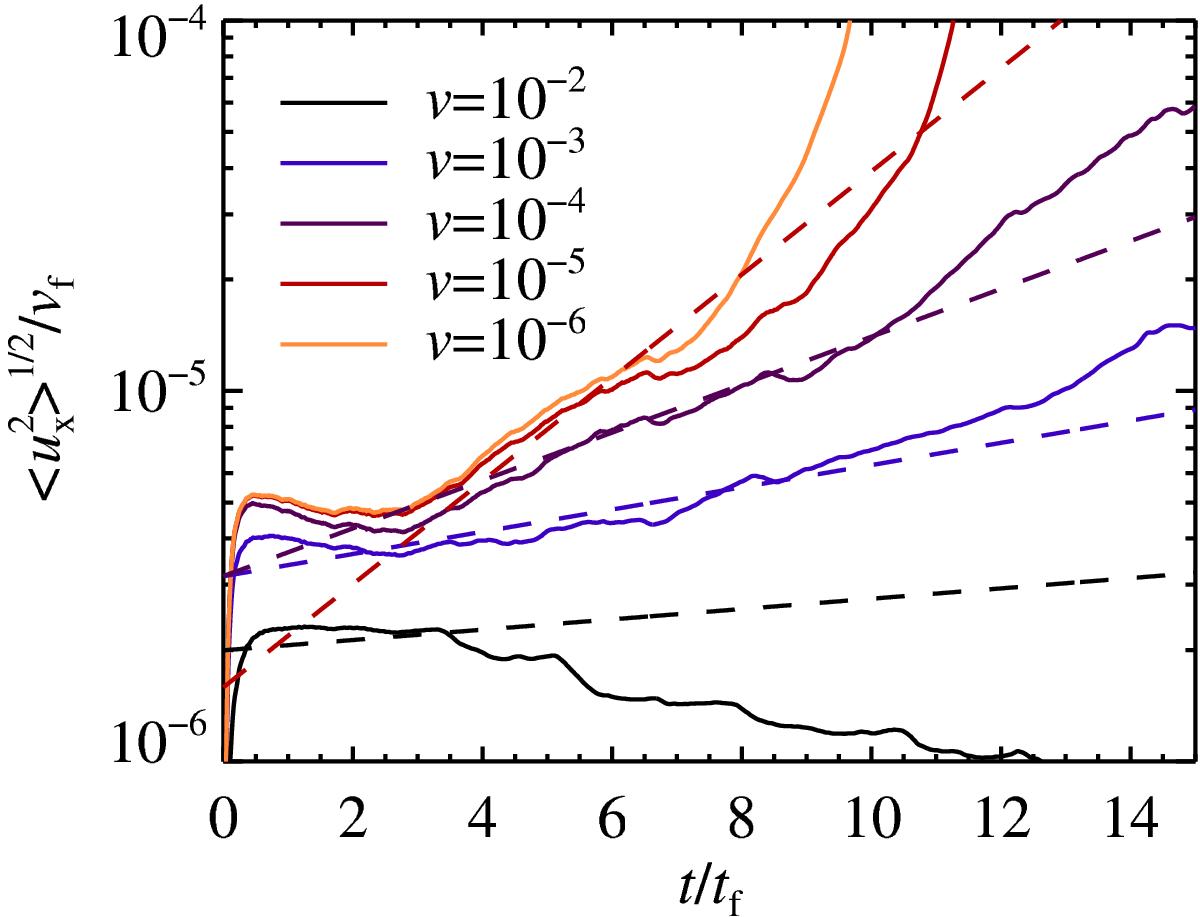
Viscosity dependency on the growth rate of the drafting instability. Dashed lines give the growth time scaling where ω ∝ ν− 1/3, as in the toy model. At high viscosities over ν′ ≈ 10-3, we no longer identify growth in the fluid velocity dispersion. Numerical results from runv2, runv3, run2, runv5, and runv6.
Current usage metrics show cumulative count of Article Views (full-text article views including HTML views, PDF and ePub downloads, according to the available data) and Abstracts Views on Vision4Press platform.
Data correspond to usage on the plateform after 2015. The current usage metrics is available 48-96 hours after online publication and is updated daily on week days.
Initial download of the metrics may take a while.