Fig. 3
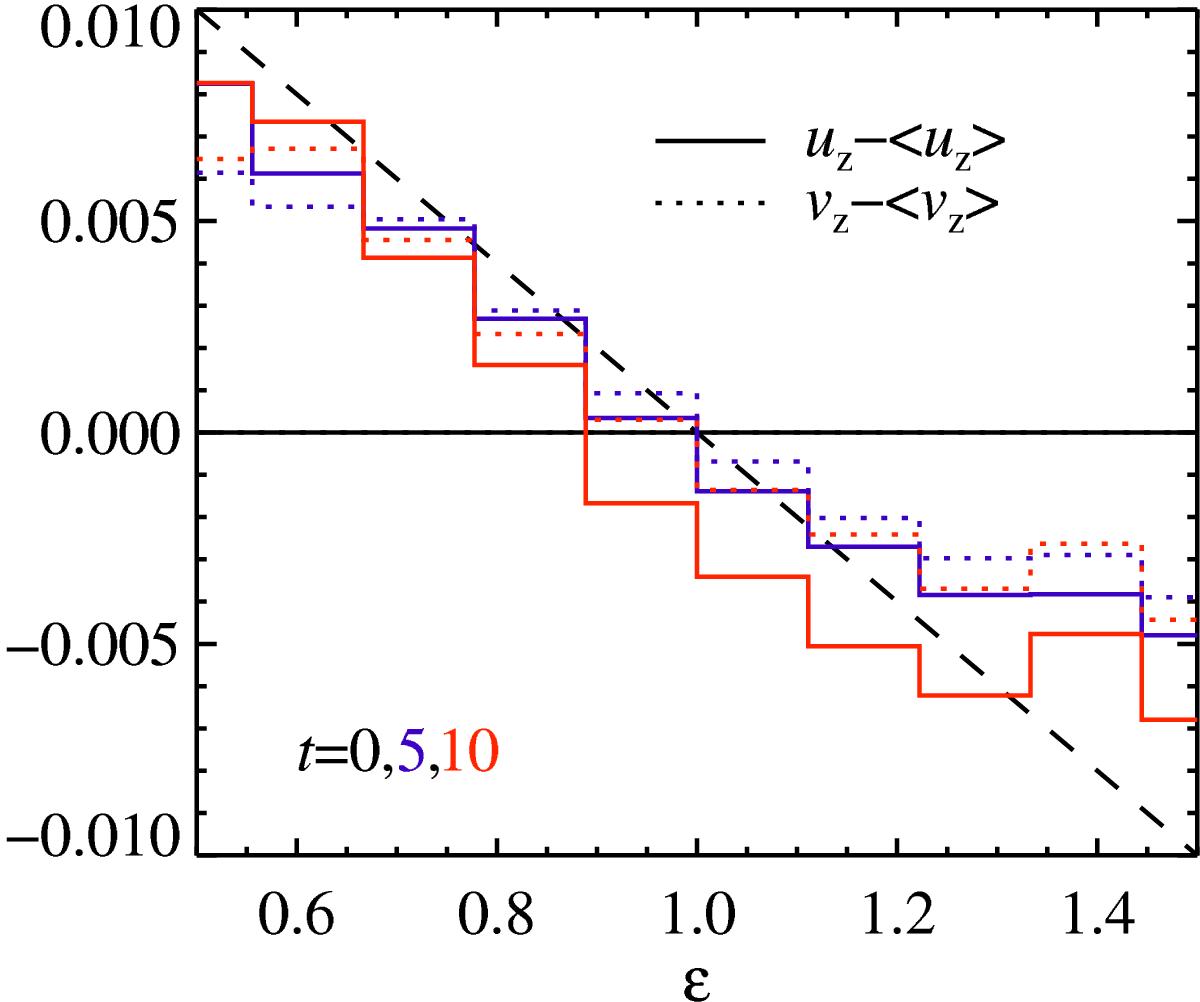
Correlation between the local dust-to-gas ratio ϵ and the deviations in the velocity of the gas uz (full line) and particles vz (dotted line). To aid interpretation, we subtracted the mean velocity of the sedimenting particles ⟨vz⟩ from the particle velocity and a small artificial upwards mean gas velocity ⟨uz⟩ from the gas velocity. Displayed are different times t = 0,5,10 tf, in respectively black, blue, and red, based on the region between z = 0–10 lf in run2. The standard deviations on the binned averages are relatively large, σ ≈ 0.03–0.04 vf for the gas and particle velocities between t = 5–10 tf. The black dashed line corresponds to α = 0.02 in the toy model (Sect. 3.5).
Current usage metrics show cumulative count of Article Views (full-text article views including HTML views, PDF and ePub downloads, according to the available data) and Abstracts Views on Vision4Press platform.
Data correspond to usage on the plateform after 2015. The current usage metrics is available 48-96 hours after online publication and is updated daily on week days.
Initial download of the metrics may take a while.