Fig. 2
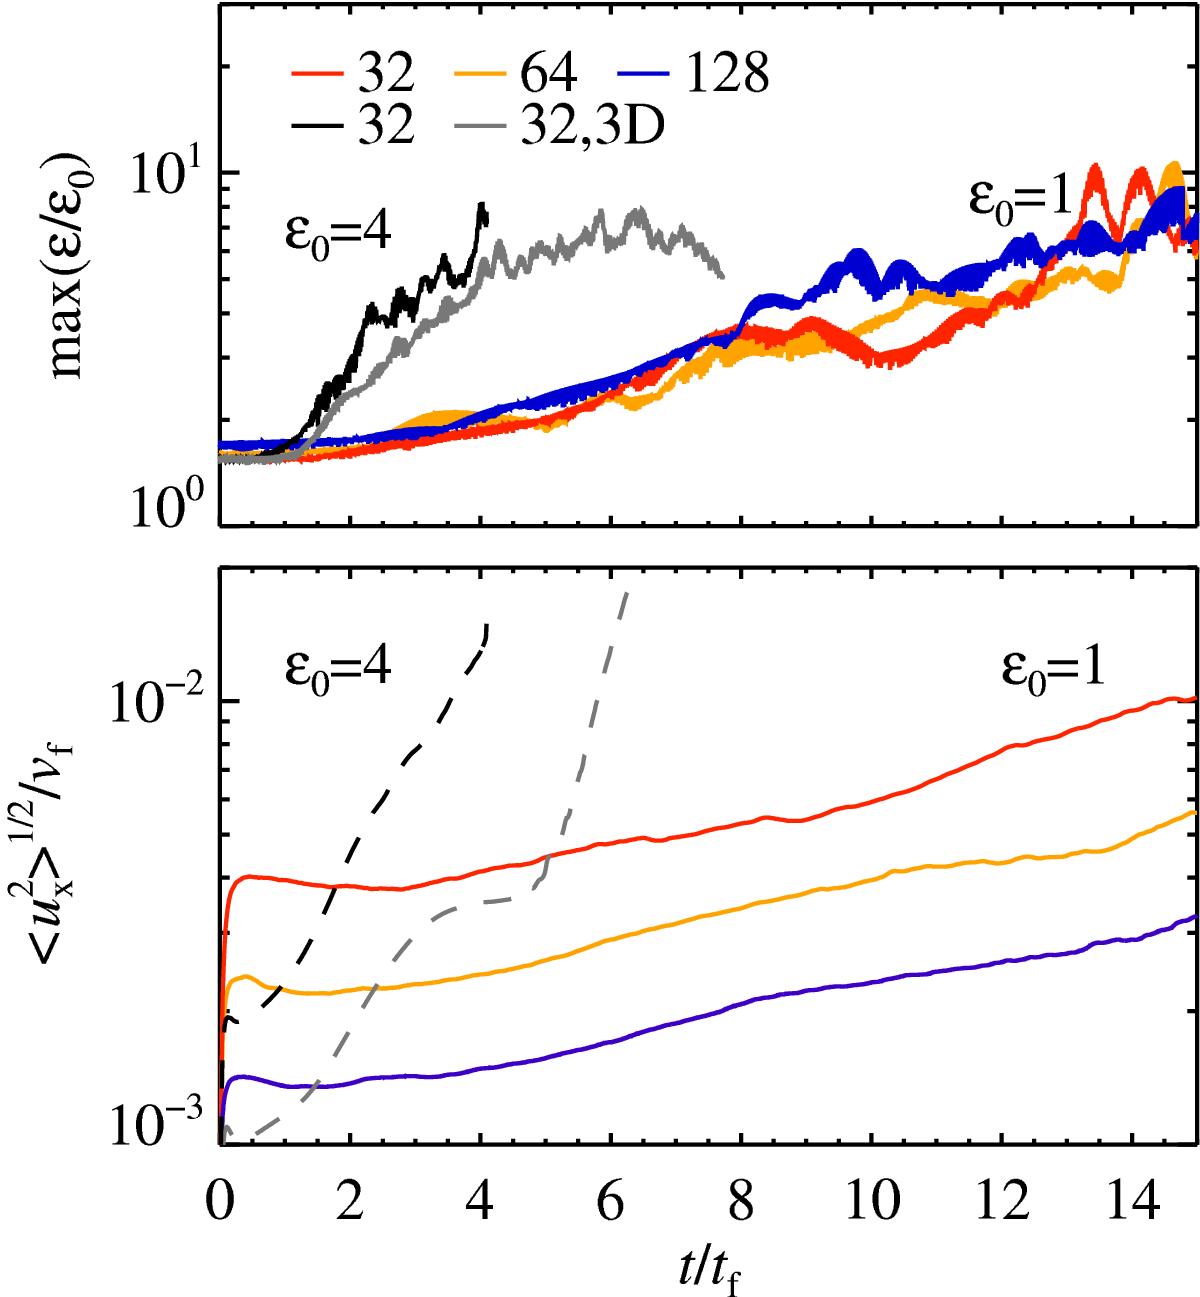
Top panel: evolution of the particle density (normalized to the background dust-to-gas ratio ϵ0), for three different resolutions in 2D simulations and a 3D simulation (run3d.4, gray). Bottom panel: evolution of the instability based on the horizontal gas dispersion, ![]() , (as an alternative tracer to the maximal particle density, which is an intrinsically noisy variable). We used a similar color coding as for the top panel. Note for the runs with ϵ0 = 4, we displaced the dashed curves for clarity with a factor 10 downwards.
, (as an alternative tracer to the maximal particle density, which is an intrinsically noisy variable). We used a similar color coding as for the top panel. Note for the runs with ϵ0 = 4, we displaced the dashed curves for clarity with a factor 10 downwards.
Current usage metrics show cumulative count of Article Views (full-text article views including HTML views, PDF and ePub downloads, according to the available data) and Abstracts Views on Vision4Press platform.
Data correspond to usage on the plateform after 2015. The current usage metrics is available 48-96 hours after online publication and is updated daily on week days.
Initial download of the metrics may take a while.