Fig. C.1
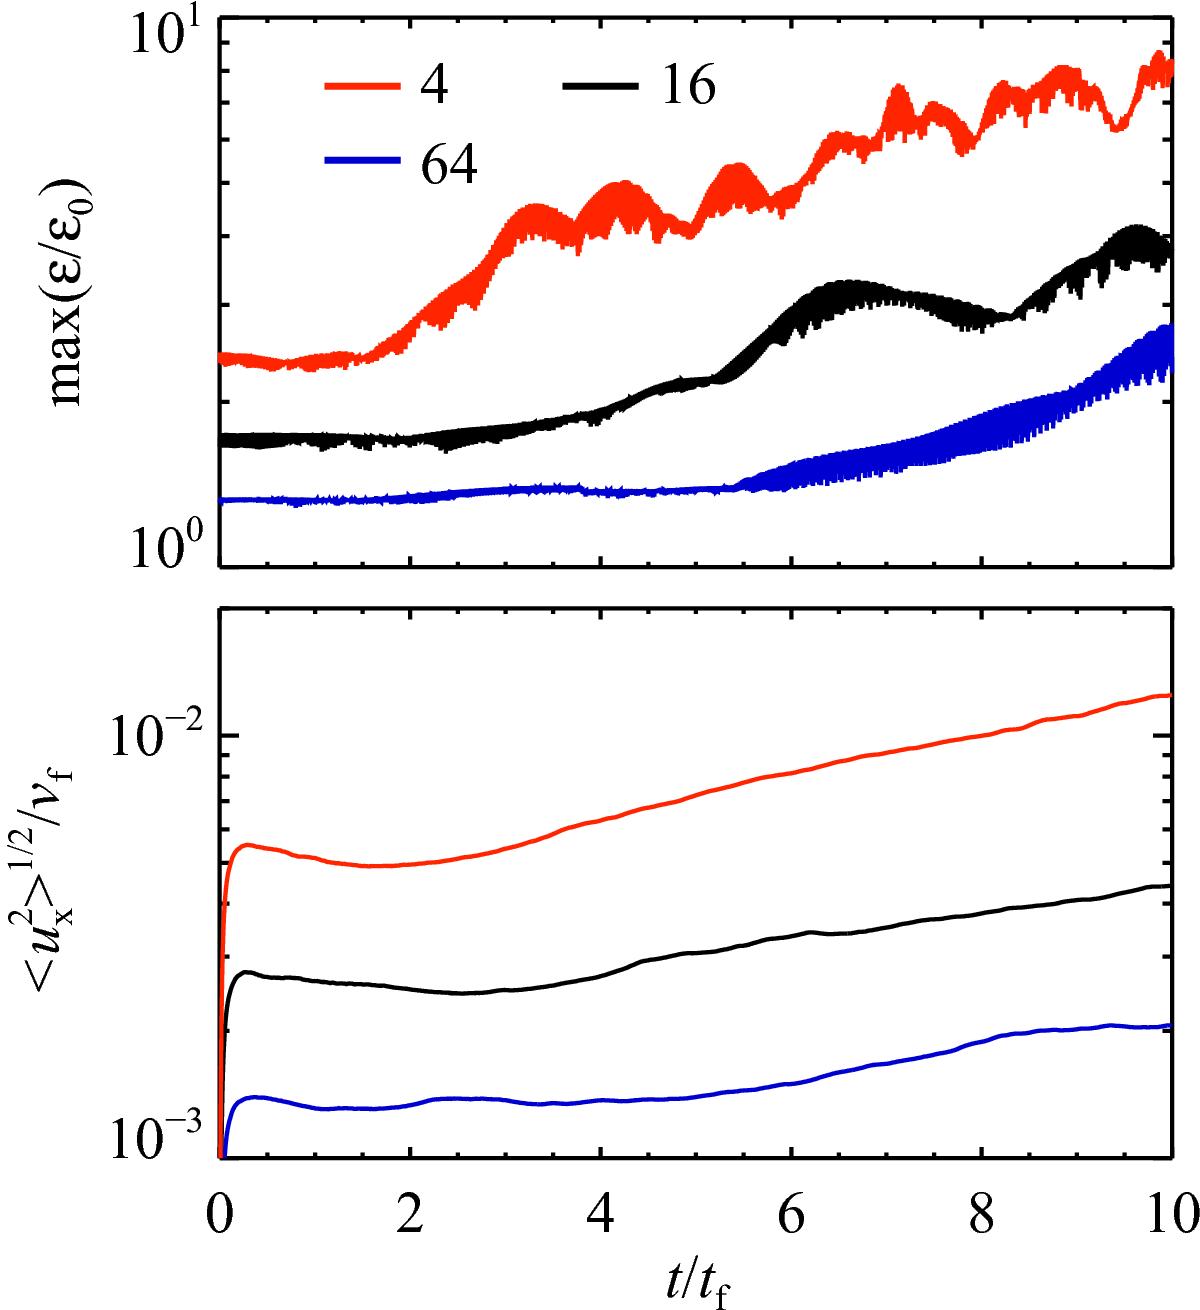
Evolution of the maximal particle density (top) and the horizontal gas dispersion (bottom), for 4, 16, and 32 particles per grid cell (respectively red, black, and blue curves). The initial maximal particle overdensity is reduced from ϵ/ϵ0 = 2.4 to 1.6 and finally 1.3, when increasing the particle number by a factor of 4 each time. The lowest particle number simulation shows fastest growth. In higher particle number runs, the initial dormant phase persists longer and growth rates become lower. Results from run2.n4, run2, and run2.n64.
Current usage metrics show cumulative count of Article Views (full-text article views including HTML views, PDF and ePub downloads, according to the available data) and Abstracts Views on Vision4Press platform.
Data correspond to usage on the plateform after 2015. The current usage metrics is available 48-96 hours after online publication and is updated daily on week days.
Initial download of the metrics may take a while.