Fig. 10
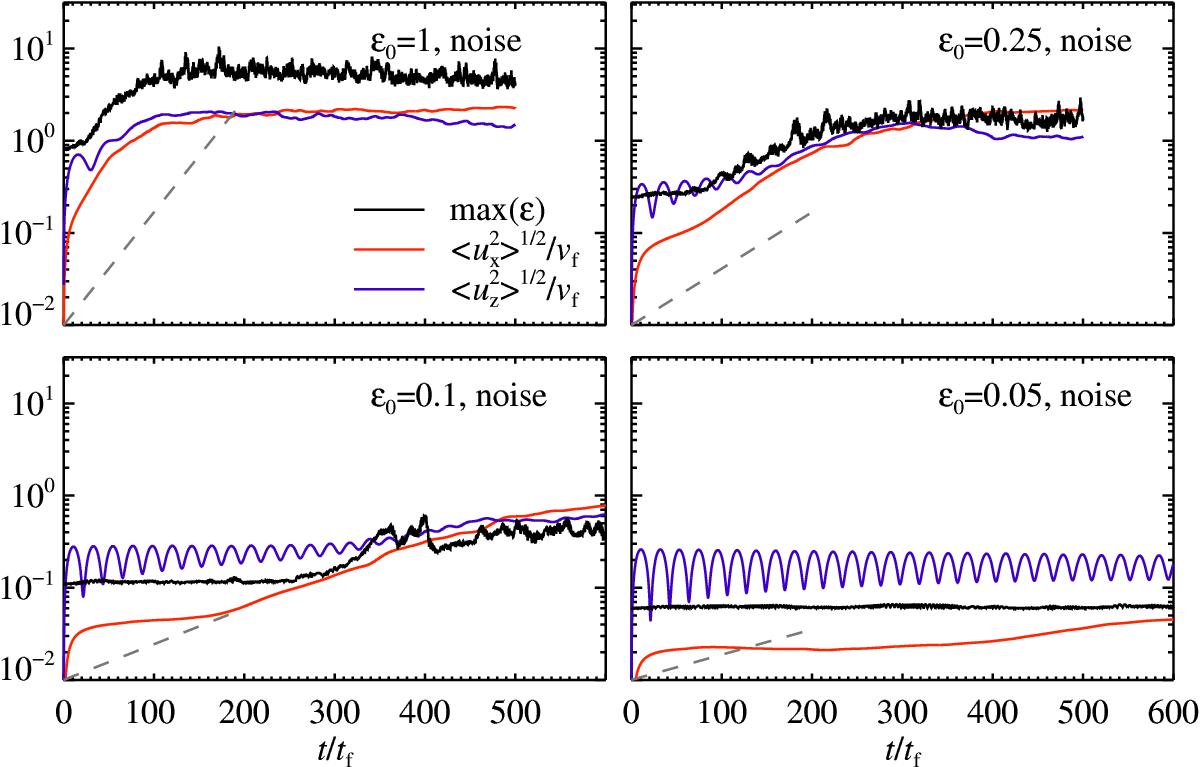
Long term evolution of the dust-to-gas ratio max(ϵ) (black), combined with the horizontal ![]() (red) and vertical
(red) and vertical ![]() (blue). The grey dashed lines represent the growth rate scaling with
(blue). The grey dashed lines represent the growth rate scaling with ![]() , as found from the toy model (Eq. (11)). The growth rate decreases with dust-to-gas ratio, and we are unable to measure growth rates below ϵ0 = 0.05. The small oscillations seen in vertical velocity dispersion for the low metallicity runs are the result of vertical waves, which are due to a slight imbalance in the initial condition in elongated domains. The figure is based on the simulations run1.01, run2.01, run3.01, and run4.01 (in order of decreasing metallicity).
, as found from the toy model (Eq. (11)). The growth rate decreases with dust-to-gas ratio, and we are unable to measure growth rates below ϵ0 = 0.05. The small oscillations seen in vertical velocity dispersion for the low metallicity runs are the result of vertical waves, which are due to a slight imbalance in the initial condition in elongated domains. The figure is based on the simulations run1.01, run2.01, run3.01, and run4.01 (in order of decreasing metallicity).
Current usage metrics show cumulative count of Article Views (full-text article views including HTML views, PDF and ePub downloads, according to the available data) and Abstracts Views on Vision4Press platform.
Data correspond to usage on the plateform after 2015. The current usage metrics is available 48-96 hours after online publication and is updated daily on week days.
Initial download of the metrics may take a while.