Fig. 7
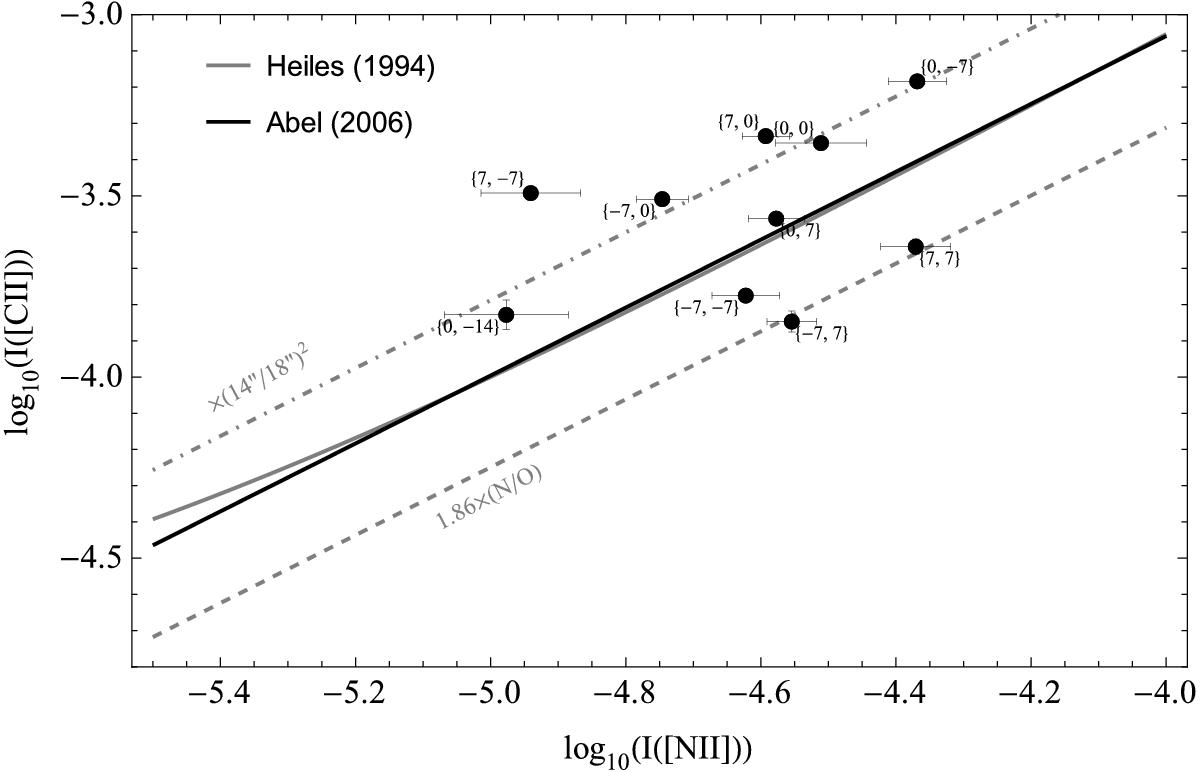
Correlation between I( [N II]) (205 μm) and I( [C II]) (159 μm). The data points are labeled with their position (in offsets of ′′). The black line corresponds to the best fit line provided by Abel (2006) and the solid gray line shows the fit given by Heiles (1994). The dashed and dot-dashed lines show how the relation by Abel (2006) is affected by an enhanced elemental (N/O) ratio ((1.86 × (N/O)) and by beam size effects (I( [N II] ) × (14″/18″)2), respectively.
Current usage metrics show cumulative count of Article Views (full-text article views including HTML views, PDF and ePub downloads, according to the available data) and Abstracts Views on Vision4Press platform.
Data correspond to usage on the plateform after 2015. The current usage metrics is available 48-96 hours after online publication and is updated daily on week days.
Initial download of the metrics may take a while.