Fig. 6
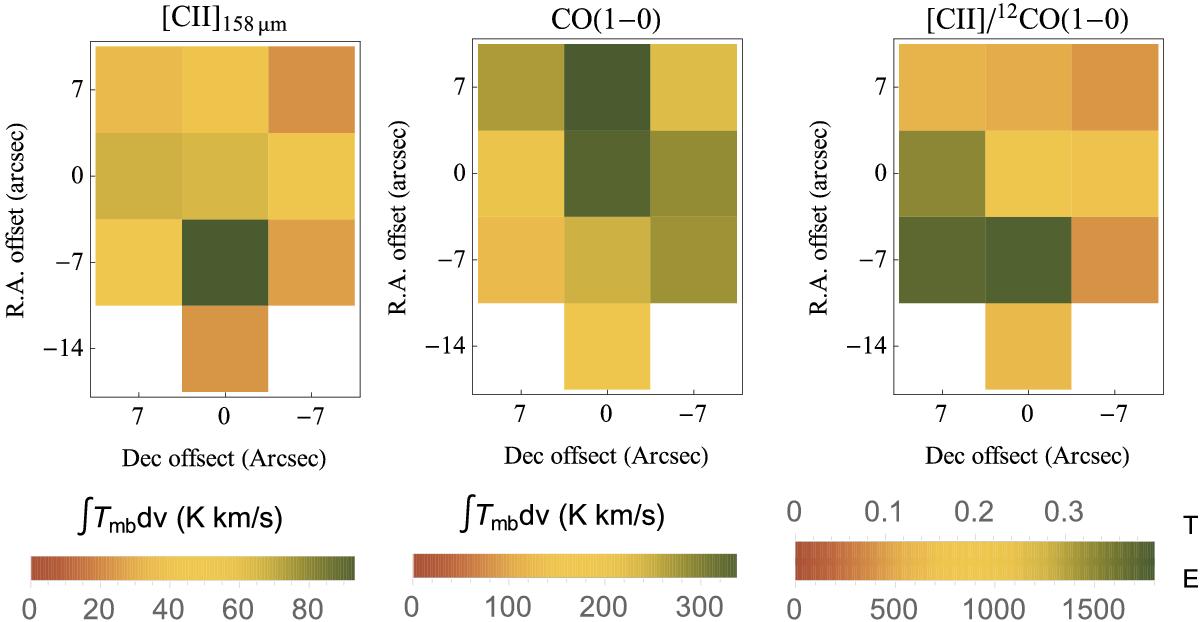
Spatial distribution of the integrated line intensities ![]() of [C II] (left), 12CO (1−0) (middle), and the I( [C II] ) /I(12CO (1-0)) line ratio (right). The colorbar of the right panel specifies the values for the line ratio calculated by using temperature units (T) and energy units (E). To convert T units to E units, multiply T by 4510. The spatial resolution is 14′′ and 18′′ for [C II] and [N II], respectively.
of [C II] (left), 12CO (1−0) (middle), and the I( [C II] ) /I(12CO (1-0)) line ratio (right). The colorbar of the right panel specifies the values for the line ratio calculated by using temperature units (T) and energy units (E). To convert T units to E units, multiply T by 4510. The spatial resolution is 14′′ and 18′′ for [C II] and [N II], respectively.
Current usage metrics show cumulative count of Article Views (full-text article views including HTML views, PDF and ePub downloads, according to the available data) and Abstracts Views on Vision4Press platform.
Data correspond to usage on the plateform after 2015. The current usage metrics is available 48-96 hours after online publication and is updated daily on week days.
Initial download of the metrics may take a while.