Fig. 3
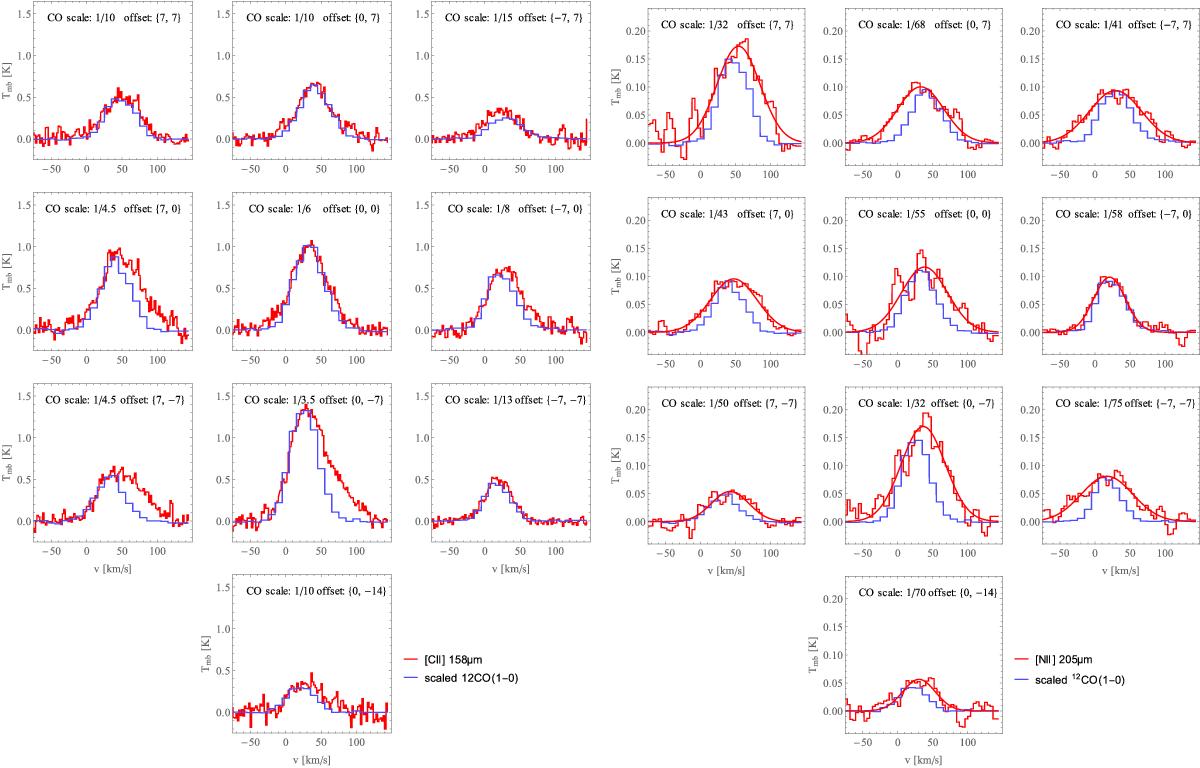
Comparison of the SOFIA fine-structure spectra with the corresponding 12CO (1−0) line profiles scaled down to match either the line wings or peak strength of the [C II] (left panel) and [N II] (right panel) profiles such that the scaled CO emission is weaker than the [C II] and [N II]at all velocities. For easier comparison, we smoothed the [N II] spectra with a moving average across three spectral channels and also show the Gaussian fits to the lines. The CO scaling factors are given at each position individually.
Current usage metrics show cumulative count of Article Views (full-text article views including HTML views, PDF and ePub downloads, according to the available data) and Abstracts Views on Vision4Press platform.
Data correspond to usage on the plateform after 2015. The current usage metrics is available 48-96 hours after online publication and is updated daily on week days.
Initial download of the metrics may take a while.