Free Access
Fig. 2
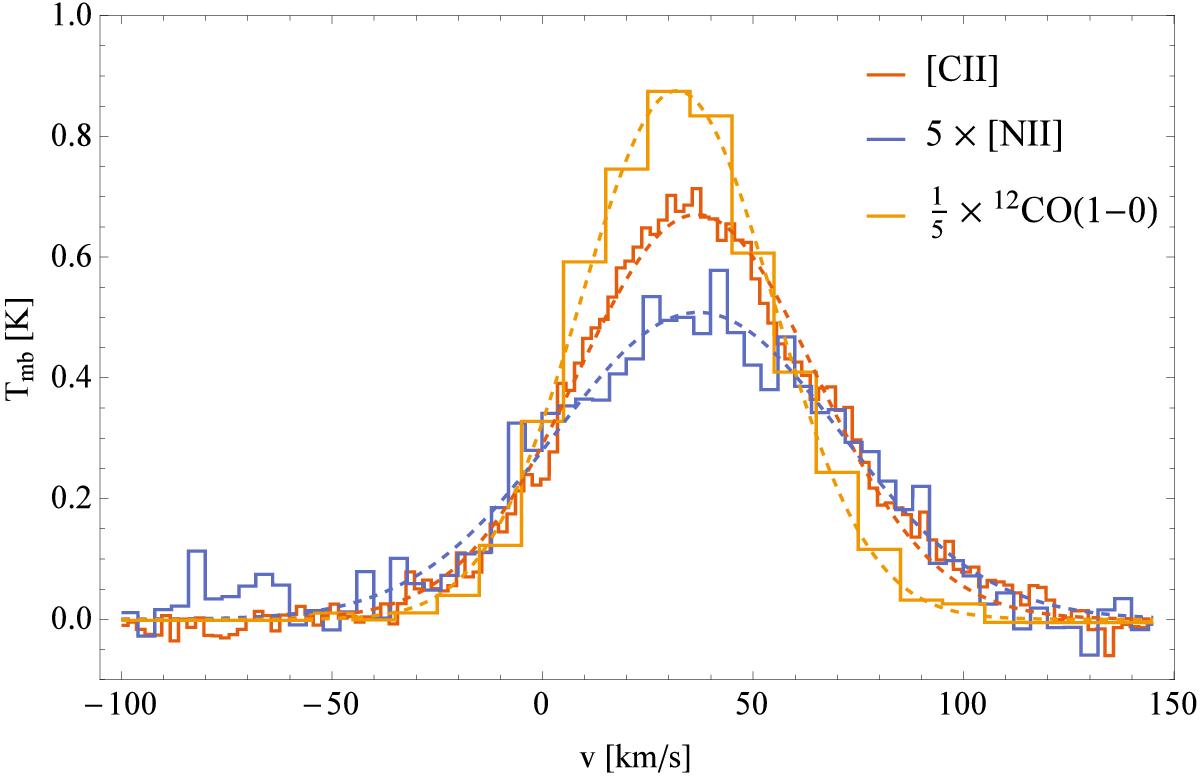
Sum spectra of [C II] and [N II] and 12CO (1−0) averaged across the central 3 × 3 grid. Individual positions were equally weighted. The [N II] intensity scale is multiplied by a factor of 5 and CO is divided by a factor of 5. The dashed lines show the result of Gaussian fits to the lines.
Current usage metrics show cumulative count of Article Views (full-text article views including HTML views, PDF and ePub downloads, according to the available data) and Abstracts Views on Vision4Press platform.
Data correspond to usage on the plateform after 2015. The current usage metrics is available 48-96 hours after online publication and is updated daily on week days.
Initial download of the metrics may take a while.