Free Access
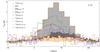
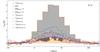
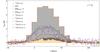
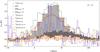
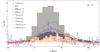
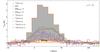
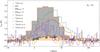
Fig. C.1
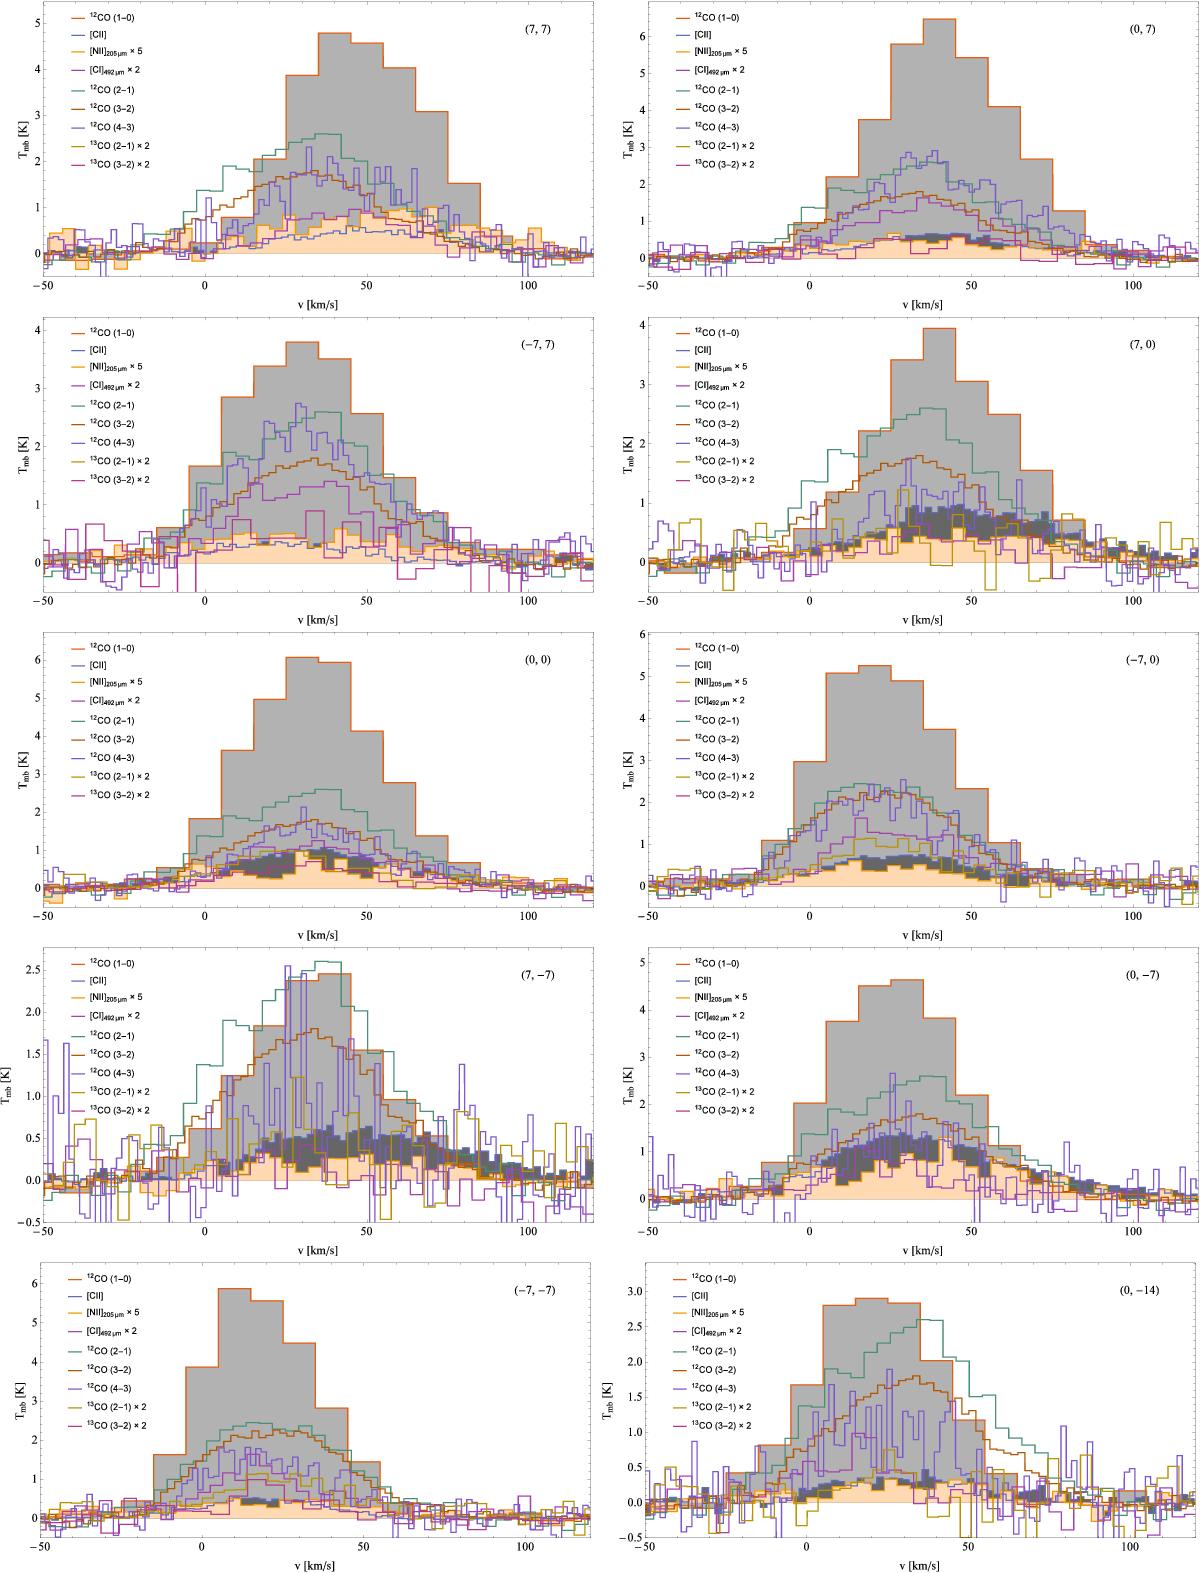
Comparison of the SOFIA data with complementary data. For easier recognition, 12CO (1−0), [N II], and [C II] spectra are shaded ([C II]: dark gray, [N II]: light orange, CO: light gray). The observed offset position is indicated in the top right corner of each panel. Note the varying scales of the ordinates.
This figure is made of several images, please see below:
Current usage metrics show cumulative count of Article Views (full-text article views including HTML views, PDF and ePub downloads, according to the available data) and Abstracts Views on Vision4Press platform.
Data correspond to usage on the plateform after 2015. The current usage metrics is available 48-96 hours after online publication and is updated daily on week days.
Initial download of the metrics may take a while.