Fig. 10
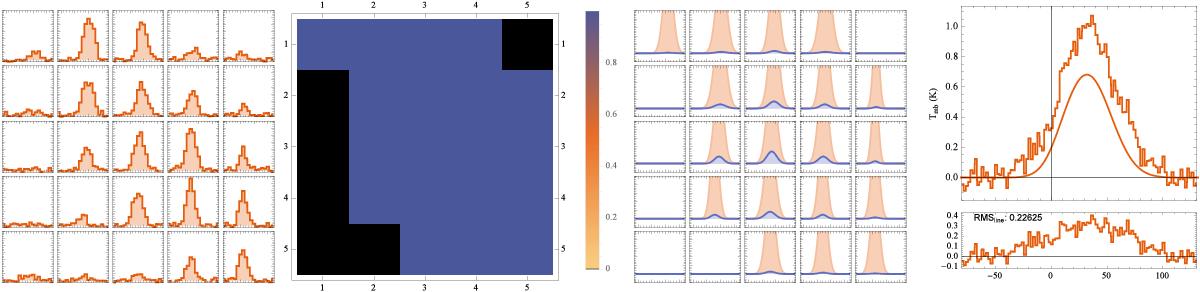
Result of the super-resolution line composition as described in Sect. 6.3 for the central [C II] spectrum (at (0′′, 0′′) offset). The array on the left shows the high-resolution Berkeley Illinois Maryland Association (BIMA) 12CO (1−0) data with a 5′′ spatial sampling. The [C II] beam FWHM covers the central 3 × 3 pixel. The second array from the left shows the spatial distribution of the peak intensities fi. Darker pixels contribute more to the overall emission. The black pixels show masked positions that are not used. The third panel shows the array of artificial [C II]![]() spectra in light red, and already weighted with the Gaussian weights applied during beam convolution in blue. The final beam convolved spectrum is a simple sum of all blue spectra in this panel. The plot on the right compares the final [C II]lo spectrum (line) with the observed [C II]obs. The residuum is shown below the spectrum. The peak intensities is limited to fi ≤ 1. The line RMS is 199 mK.
spectra in light red, and already weighted with the Gaussian weights applied during beam convolution in blue. The final beam convolved spectrum is a simple sum of all blue spectra in this panel. The plot on the right compares the final [C II]lo spectrum (line) with the observed [C II]obs. The residuum is shown below the spectrum. The peak intensities is limited to fi ≤ 1. The line RMS is 199 mK.
Current usage metrics show cumulative count of Article Views (full-text article views including HTML views, PDF and ePub downloads, according to the available data) and Abstracts Views on Vision4Press platform.
Data correspond to usage on the plateform after 2015. The current usage metrics is available 48-96 hours after online publication and is updated daily on week days.
Initial download of the metrics may take a while.