Fig. 1
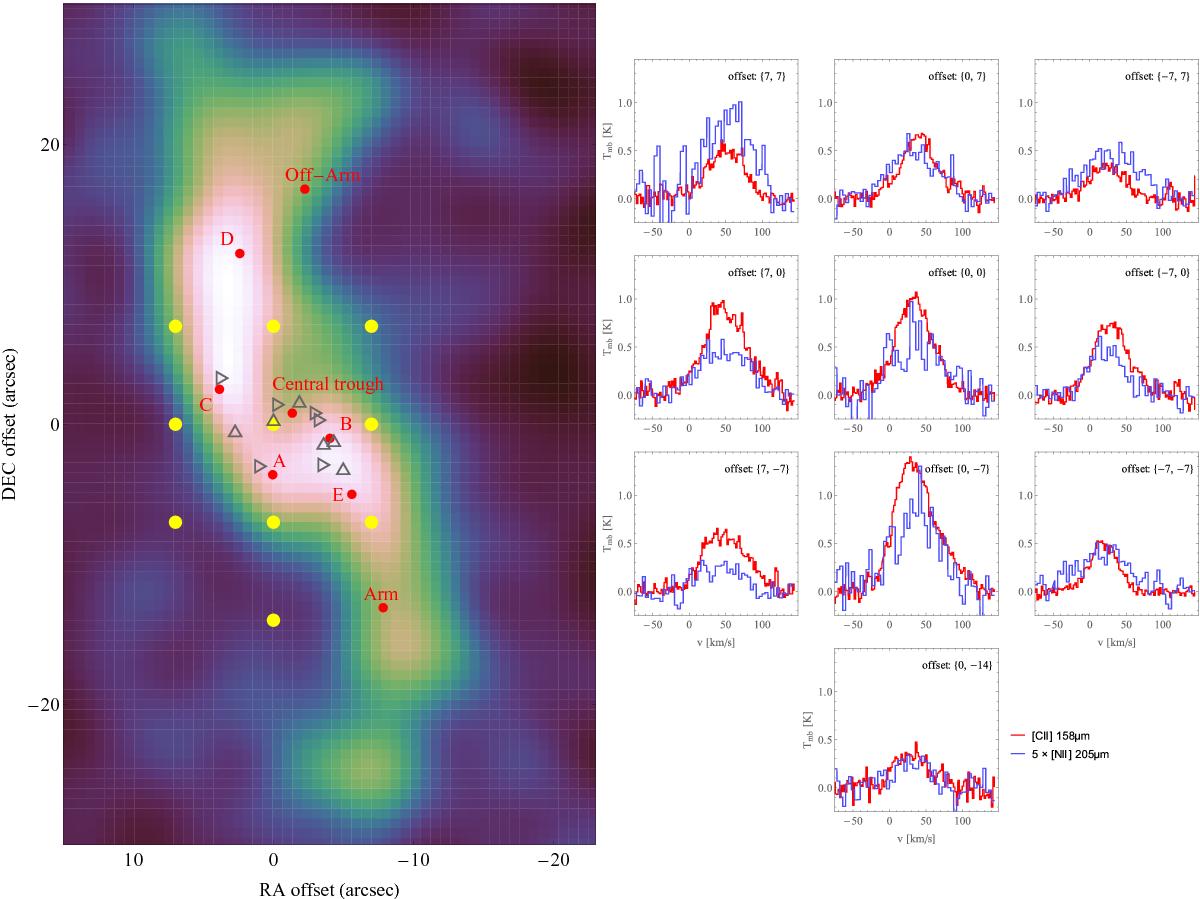
Line-integrated map of the 12CO(1−0) transition from the BIMA-SONG sample. The yellow points show the observed GREAT positions in IC 342. The (0, 0) position corresponds to (RA, Dec) (J2000) (03:46:48.5 68:05:47). The red points indicate named GMCs and other structures according to Table 3 in Meier & Turner (2001). Triangles facing up and right indicate H II regions and super nova remnants, respectively, as given by Tsai et al. (2006). The [C II] and [N II] spectra are shown on the right side. The [N II] intensity scale is multiplied by a factor of 5.
Current usage metrics show cumulative count of Article Views (full-text article views including HTML views, PDF and ePub downloads, according to the available data) and Abstracts Views on Vision4Press platform.
Data correspond to usage on the plateform after 2015. The current usage metrics is available 48-96 hours after online publication and is updated daily on week days.
Initial download of the metrics may take a while.