Free Access
Fig. 8
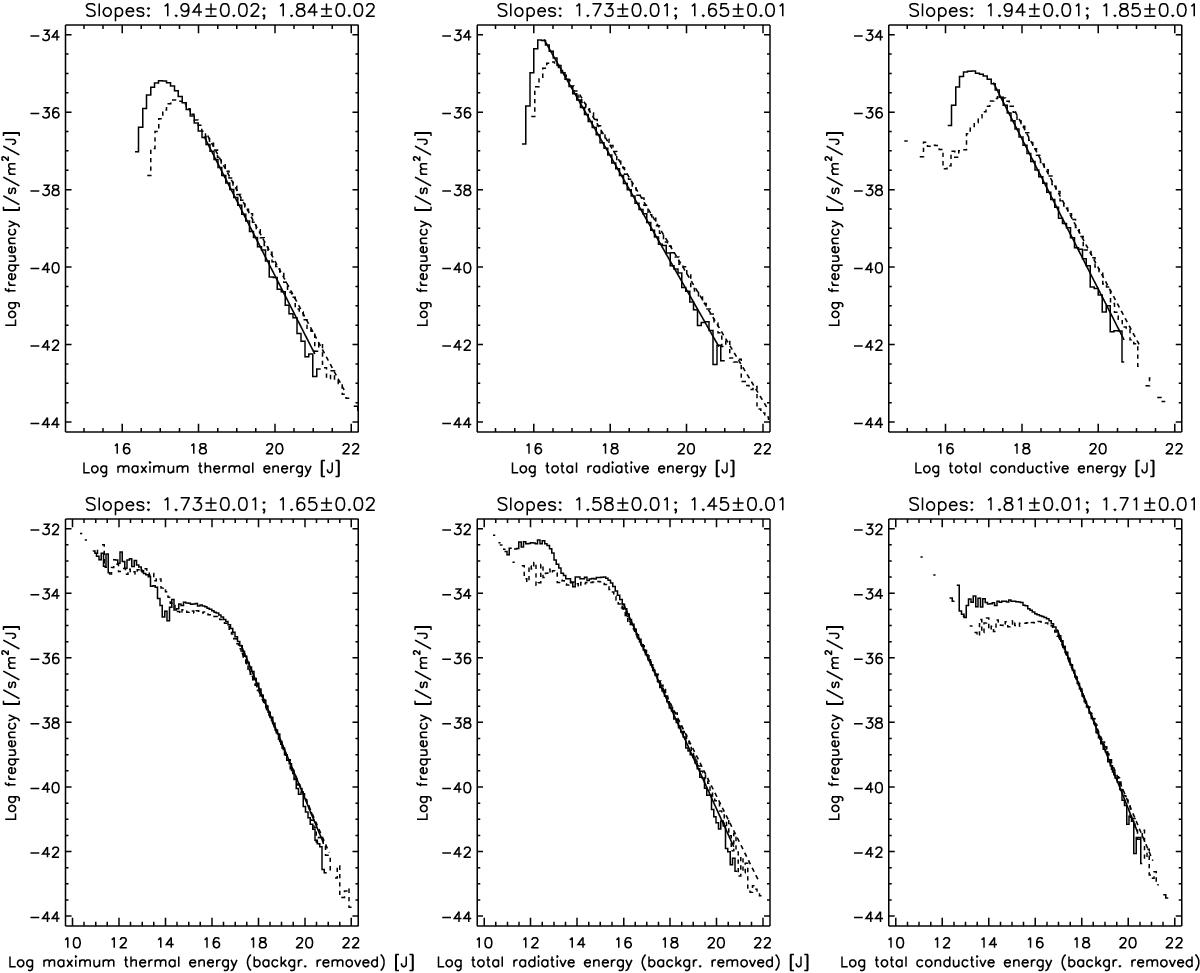
Frequency distributions of thermal, radiative, and conduction energies (from left to right) for the combined events for period 1 (plain lines) and period 2 (dashed lines). The top panels are for quantities before background subtraction and the bottom panels are for background-subtracted quantities.
Current usage metrics show cumulative count of Article Views (full-text article views including HTML views, PDF and ePub downloads, according to the available data) and Abstracts Views on Vision4Press platform.
Data correspond to usage on the plateform after 2015. The current usage metrics is available 48-96 hours after online publication and is updated daily on week days.
Initial download of the metrics may take a while.