Fig. 7
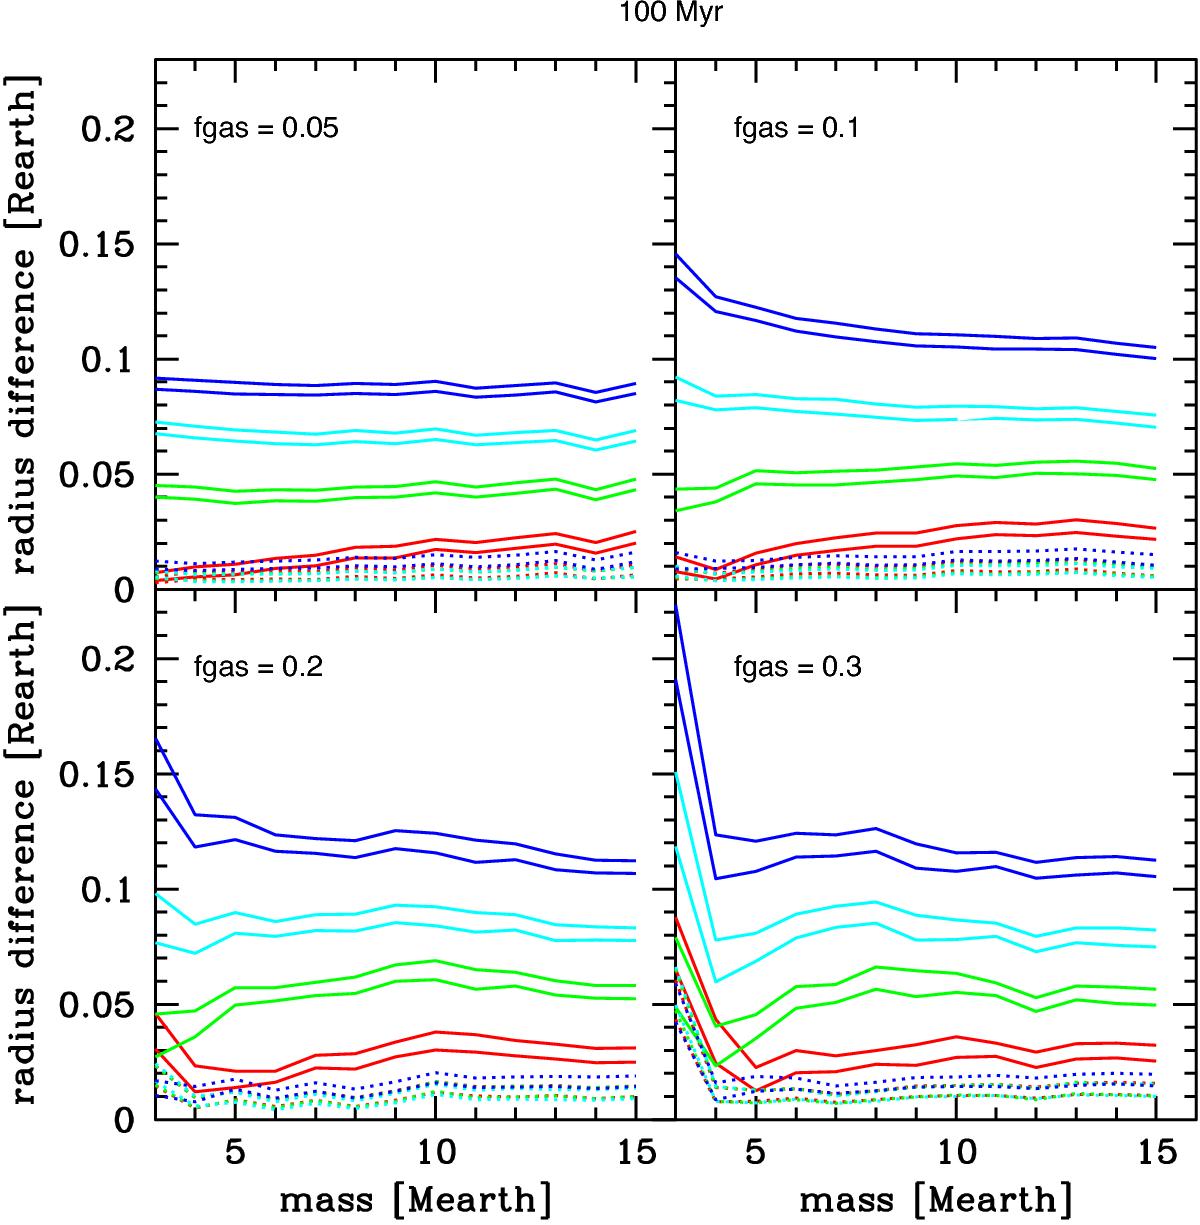
Distance between the radius distribution of volatile-poor and volatile-rich planets as a function of their mass (horizontal axis) and volatile fraction (color: blue shows a 70% volatile fraction, cyan 50%, green 30%, and red 10%). The two solid lines give the 1σ distribution of the distance obtained after running the same calculation 500 times. The dotted line shows the distance between the radius distribution at 5 Gyr (a measure of the intrinsic variability of the radius distribution – also responsible for the noise evident in all curves), while the solid lines show the distance at 100 Myr. For this figure, we have considered 500 planets in each case.
Current usage metrics show cumulative count of Article Views (full-text article views including HTML views, PDF and ePub downloads, according to the available data) and Abstracts Views on Vision4Press platform.
Data correspond to usage on the plateform after 2015. The current usage metrics is available 48-96 hours after online publication and is updated daily on week days.
Initial download of the metrics may take a while.