Fig. 6
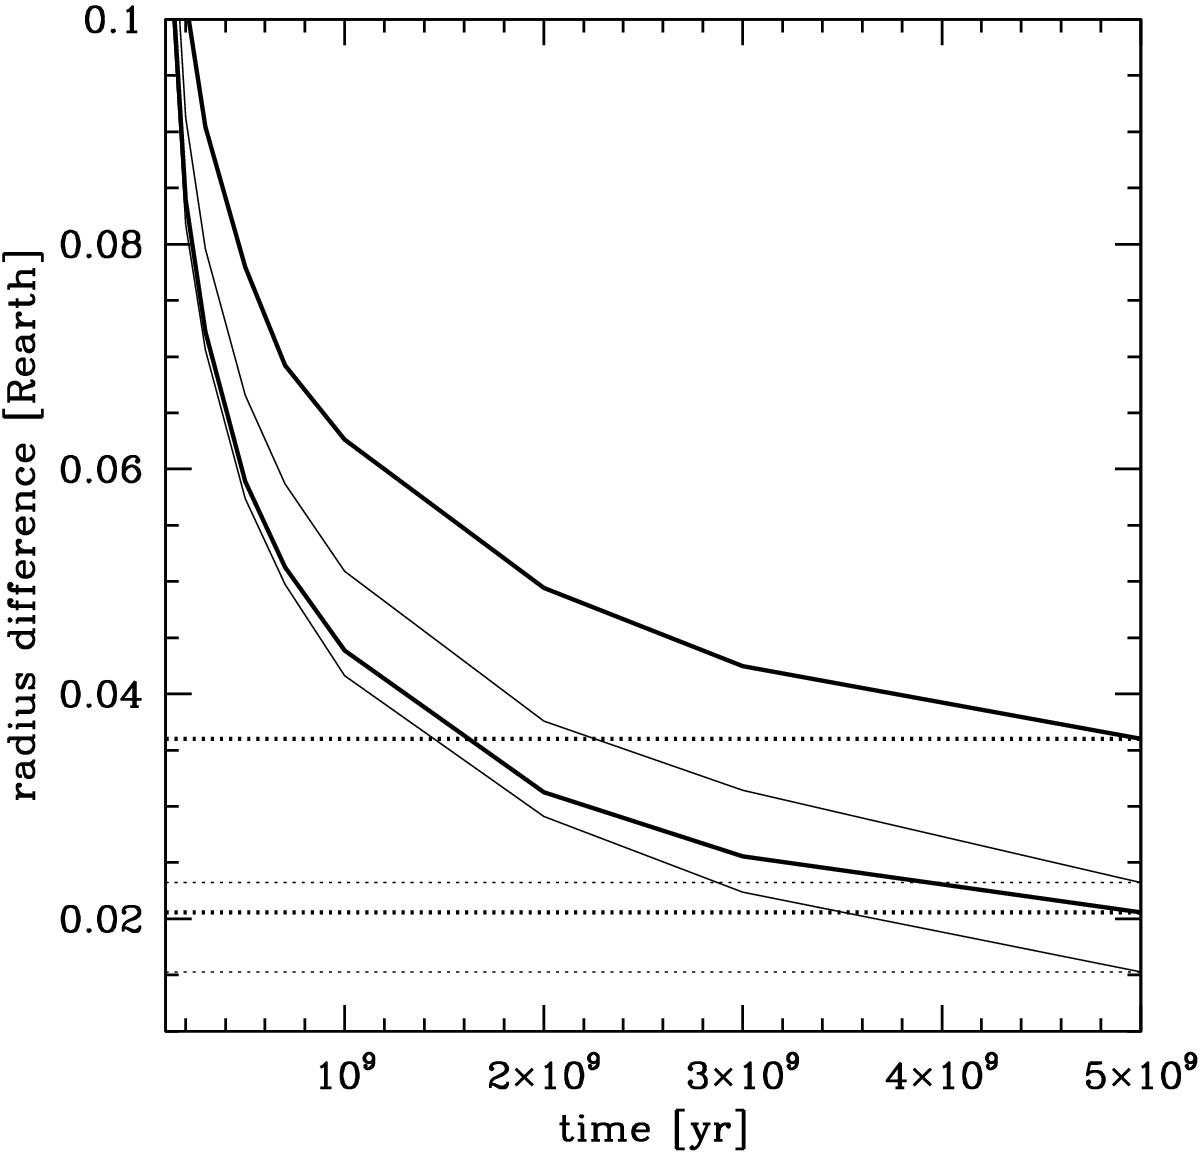
Radius difference between the radius distribution of volatile-poor (fvol = 0) and volatile-rich (fvol = 0.7) planets at different ages. The derivation of the radius difference is explained in the text, and the gas fraction of the two populations is adjusted so that the mean radius of the two populations is the same at 5 Gyr, the gas fraction of the gas-poor population being 0.2. The heavy lines were computed assuming 100 planets are observed, while the thin lines were computed assuming 500 planets are observed. The two solid lines give the 1σ range of the distance, while the horizontal dotted lines are the 1σ variation of the mean distance at 5 Gyr. These latter values give the variability in distance that is caused by the uncertainties in the measurements and the variability of the planetary parameters.
Current usage metrics show cumulative count of Article Views (full-text article views including HTML views, PDF and ePub downloads, according to the available data) and Abstracts Views on Vision4Press platform.
Data correspond to usage on the plateform after 2015. The current usage metrics is available 48-96 hours after online publication and is updated daily on week days.
Initial download of the metrics may take a while.