Fig. 11
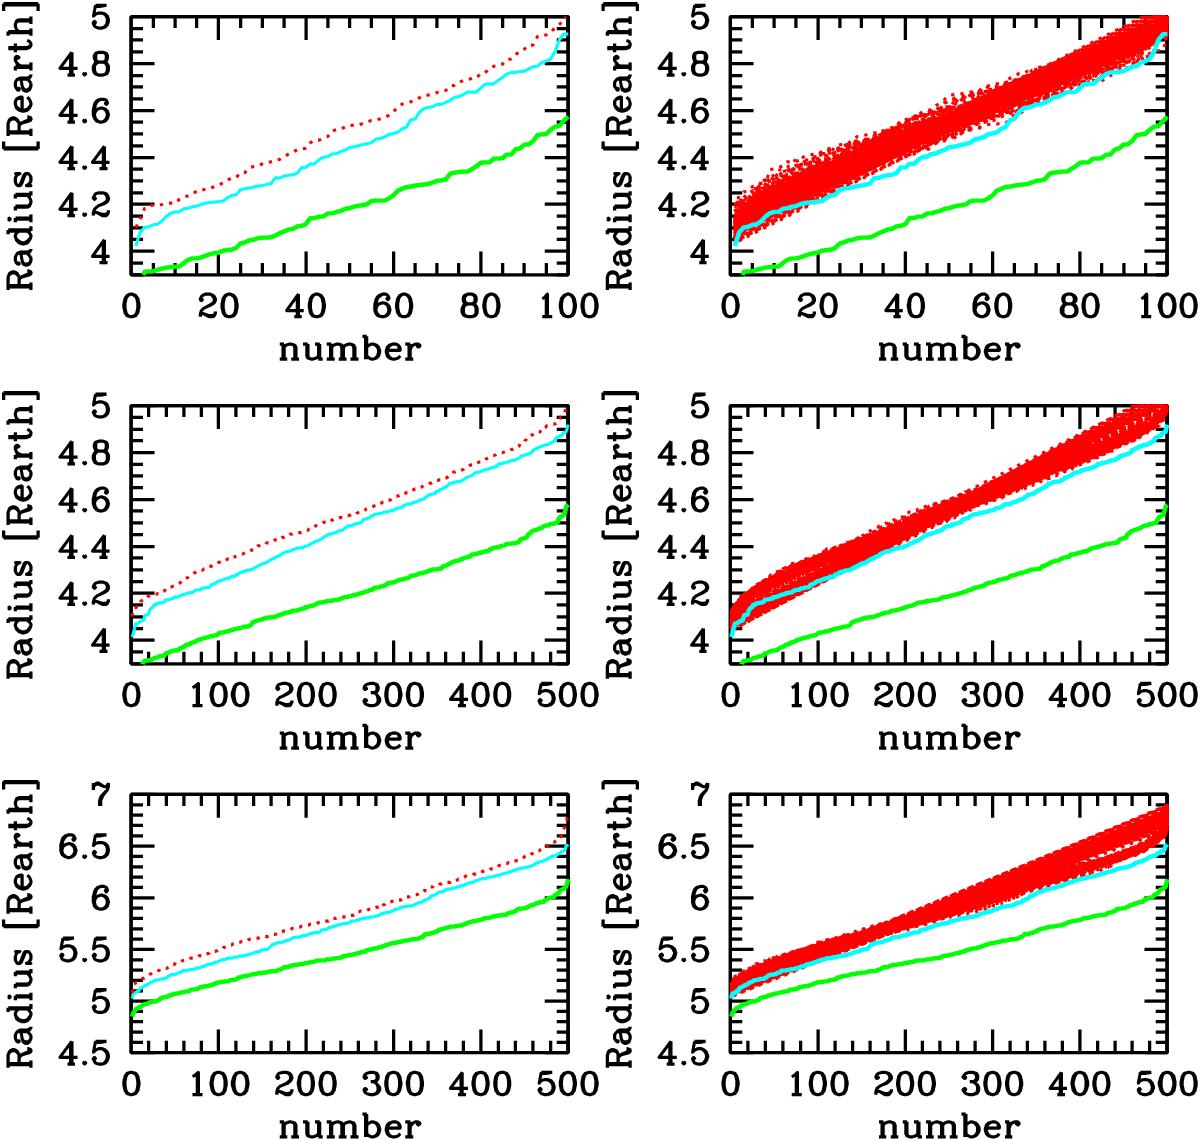
Upper left: simulated cumulative distribution of two planetary samples at 5 Gyr (lower solid green line) and 100 Myr (upper solid cyan line). The double dotted line is the computed cumulative radius distribution at 100 Myr, assuming volatile-poor planets. Top right: observed cumulative distributions of radius at 100 Myr (upper solid cyan line) at 5 Gyr (lower solid green line). The set of red lines are the computed cumulative radius distribution at 100 Myr assuming volatile-poor planets. Middle line left and right: same as upper left and right panels, but assuming 500 planets are observed instead of 100 planets. Lower left and right: same as upper left and right panels, but assuming an equilibrium temperature of 1000 K.
Current usage metrics show cumulative count of Article Views (full-text article views including HTML views, PDF and ePub downloads, according to the available data) and Abstracts Views on Vision4Press platform.
Data correspond to usage on the plateform after 2015. The current usage metrics is available 48-96 hours after online publication and is updated daily on week days.
Initial download of the metrics may take a while.