Fig. 10
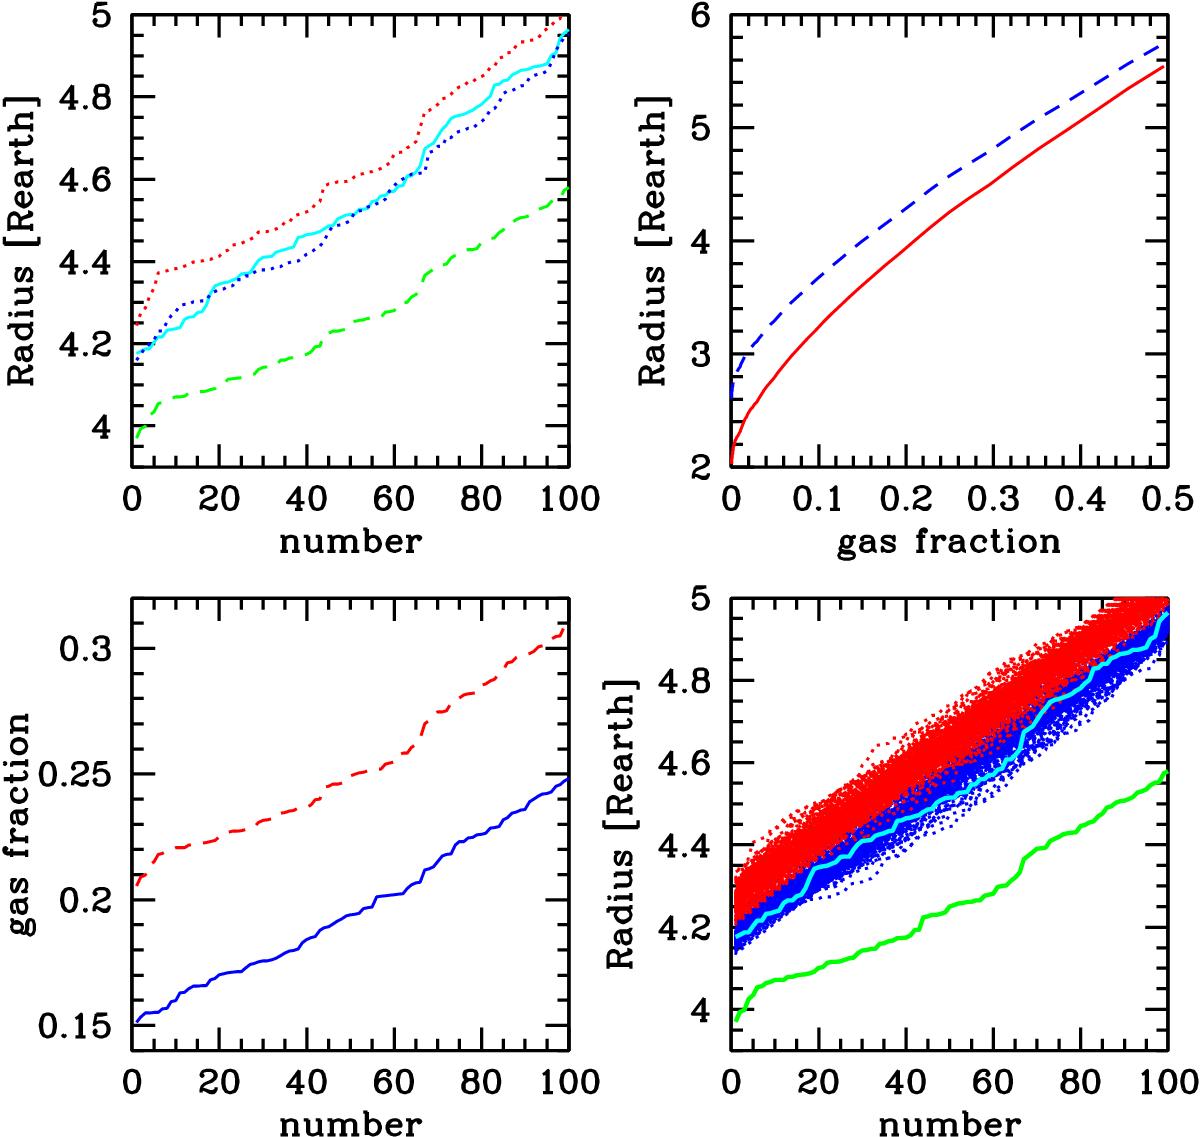
Top left: simulated cumulative distribution of two planetary samples at 5 Gyr (dashed line) and 100 Myr (solid line). The two dotted lines are the computed cumulative radius distribution at 100 Myr, assuming volatile-poor (upper curve) and volatile-rich (lower curve) planets. Top right: radius of a 12 M⊕ planet as a function of the gas fraction. The upper curve is computed assuming a volatile fraction fvol = 70%, while the lower curve shows dry planets (fvol = 0). Bottom left: cumulative distribution of the gas fraction for volatile-rich planets (hypothesis 1) and volatile-poor planets (hypothesis 2). Bottom right: observed cumulative distributions of radius at 100 Myr (thick cyan line), at 5 Gyr (thick green line). The two sets of red and blue lines are the computed cumulative radius distribution at 100 Myr assuming volatile-rich planets (hypothesis 1, blue dotted curve) or volatile-poor planets (hypothesis 2, red dotted curve).
Current usage metrics show cumulative count of Article Views (full-text article views including HTML views, PDF and ePub downloads, according to the available data) and Abstracts Views on Vision4Press platform.
Data correspond to usage on the plateform after 2015. The current usage metrics is available 48-96 hours after online publication and is updated daily on week days.
Initial download of the metrics may take a while.