Fig. 3
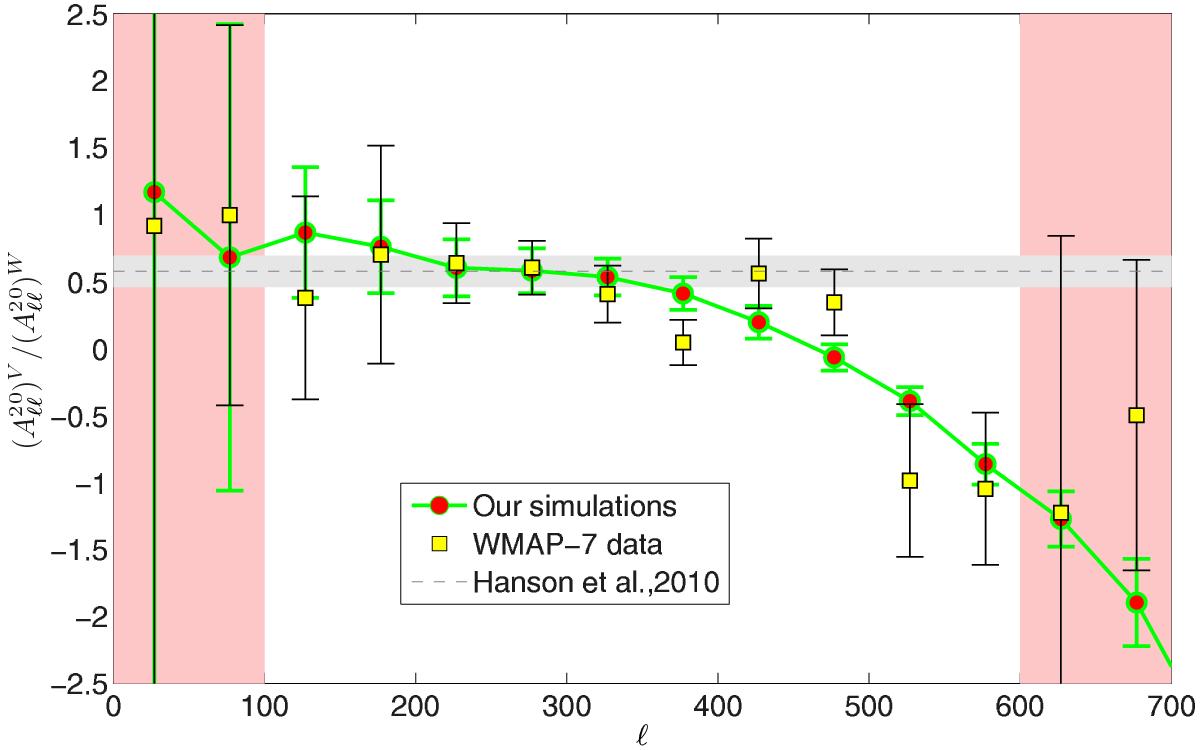
Ratio of the BipoSH spectra ![]() for the V and the W bands. The trend recovered by our detailed analysis clearly matches the WMAP7 observations. The very low and high multipole regions which have poor S/N are indicated with pink shading. We also plot the ratio corresponding to Hanson et al. (2010) estimates, which is consistent with observations at low-ℓs, but, not surprisingly, far off at high-ℓs.
for the V and the W bands. The trend recovered by our detailed analysis clearly matches the WMAP7 observations. The very low and high multipole regions which have poor S/N are indicated with pink shading. We also plot the ratio corresponding to Hanson et al. (2010) estimates, which is consistent with observations at low-ℓs, but, not surprisingly, far off at high-ℓs.
Current usage metrics show cumulative count of Article Views (full-text article views including HTML views, PDF and ePub downloads, according to the available data) and Abstracts Views on Vision4Press platform.
Data correspond to usage on the plateform after 2015. The current usage metrics is available 48-96 hours after online publication and is updated daily on week days.
Initial download of the metrics may take a while.