Fig. 2
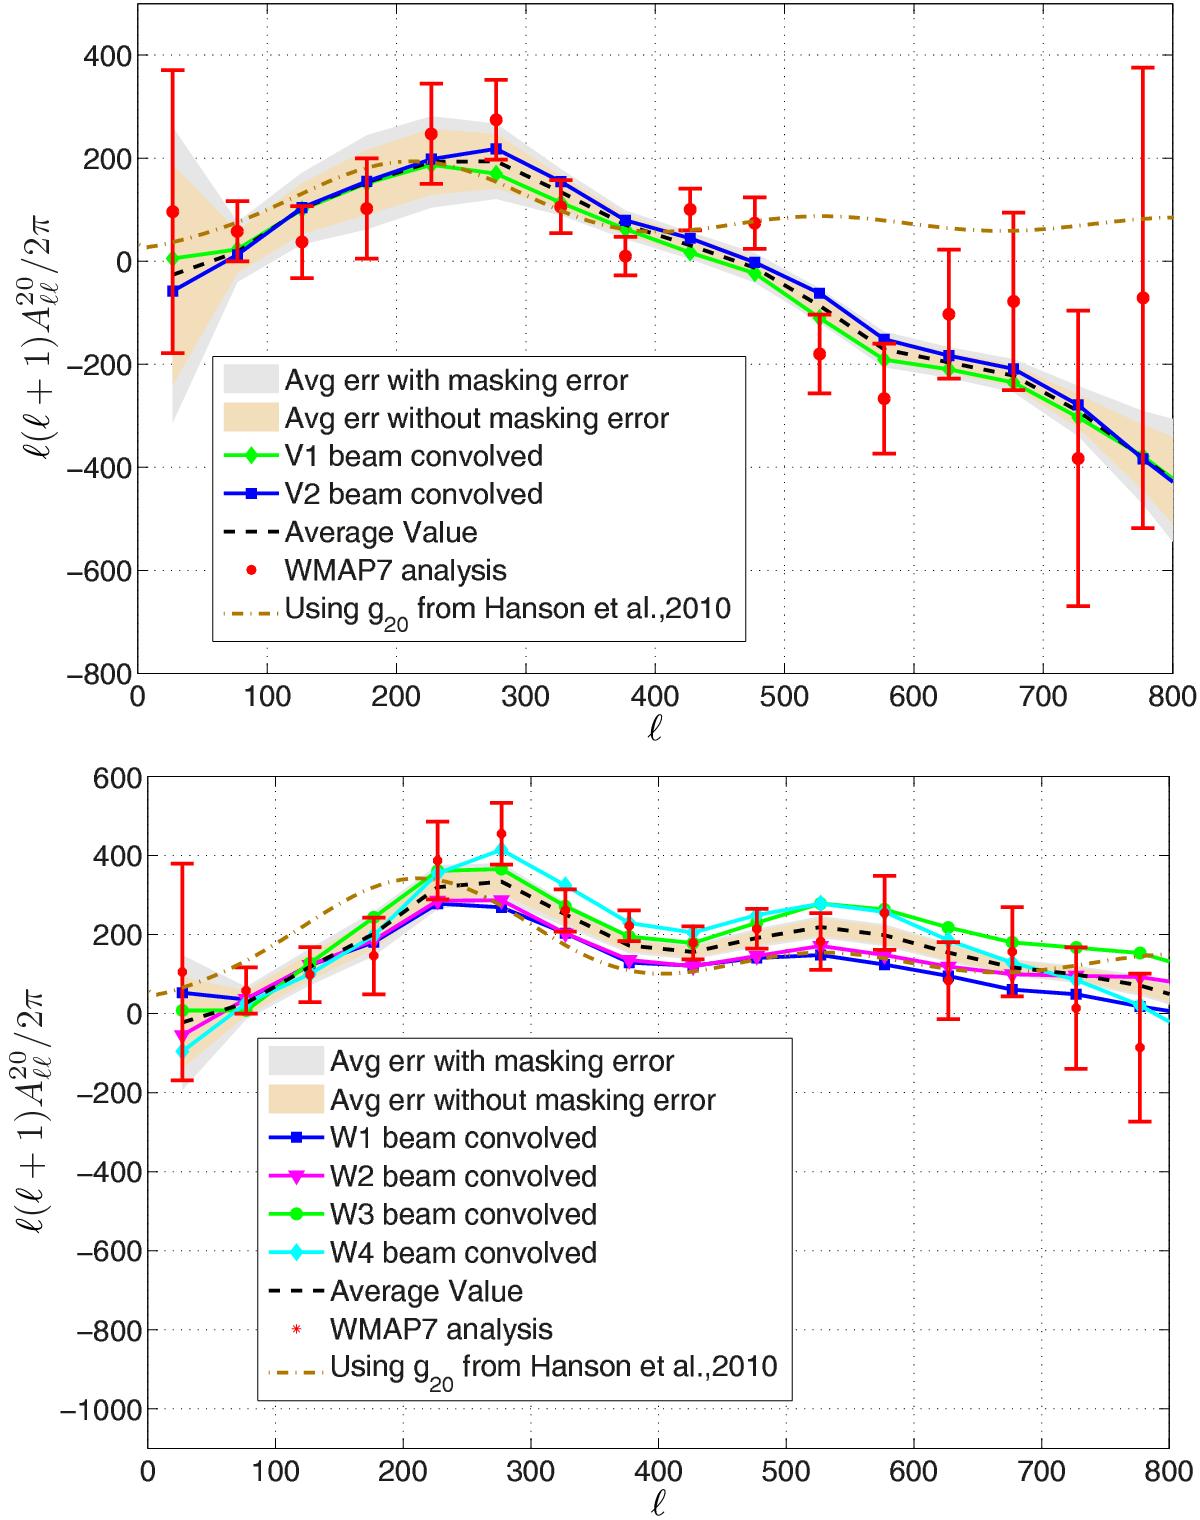
Comparison between the beam window function corrected BipoSH spectra ![]() obtained from WMAP maps (red errorbars), observed in V (top) and W (bottom) bands, and our detailed simulations of the respective channels (solid lines). The average BipoSH spectra across the DAs are denoted by the dashed lines. The saffron band shows the standard error derived from all the simulations for each band only (total 60 simulations for V and 120 for W), while the grey band also combines the error on the mask bias correction. Spectra from the simulated maps match the observed spectra very well, correctly reproducing the location of the peak and the zero crossings. Also plotted are the spectra (dash-dot lines) evaluated from the aPPS model parameterised by g20 provided in Table 1 of Hanson et al. (2010) to emphasise that a surrogate estimator is unlikely to capture these subtle effects.
obtained from WMAP maps (red errorbars), observed in V (top) and W (bottom) bands, and our detailed simulations of the respective channels (solid lines). The average BipoSH spectra across the DAs are denoted by the dashed lines. The saffron band shows the standard error derived from all the simulations for each band only (total 60 simulations for V and 120 for W), while the grey band also combines the error on the mask bias correction. Spectra from the simulated maps match the observed spectra very well, correctly reproducing the location of the peak and the zero crossings. Also plotted are the spectra (dash-dot lines) evaluated from the aPPS model parameterised by g20 provided in Table 1 of Hanson et al. (2010) to emphasise that a surrogate estimator is unlikely to capture these subtle effects.
Current usage metrics show cumulative count of Article Views (full-text article views including HTML views, PDF and ePub downloads, according to the available data) and Abstracts Views on Vision4Press platform.
Data correspond to usage on the plateform after 2015. The current usage metrics is available 48-96 hours after online publication and is updated daily on week days.
Initial download of the metrics may take a while.