Fig. 2
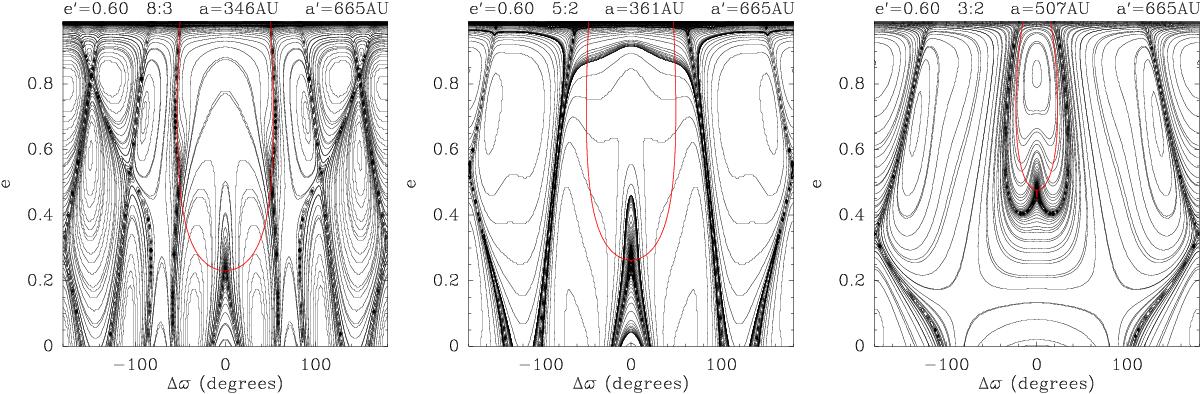
Phase portraits of resonant Hamiltonian (3) in (Δϖ,e) space after averaging over the orbital motion of P9, for particles with zero resonant amplitude libration (see text), with the same input parameters in Fig. 1. Each map corresponds to a specific MMR that is specified on top of the plot together with the corresponding semi-major axis value. The red curve has the same meaning as in Fig. 1.
Current usage metrics show cumulative count of Article Views (full-text article views including HTML views, PDF and ePub downloads, according to the available data) and Abstracts Views on Vision4Press platform.
Data correspond to usage on the plateform after 2015. The current usage metrics is available 48-96 hours after online publication and is updated daily on week days.
Initial download of the metrics may take a while.