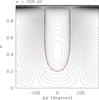
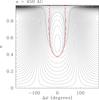
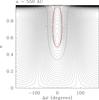
Fig. 1
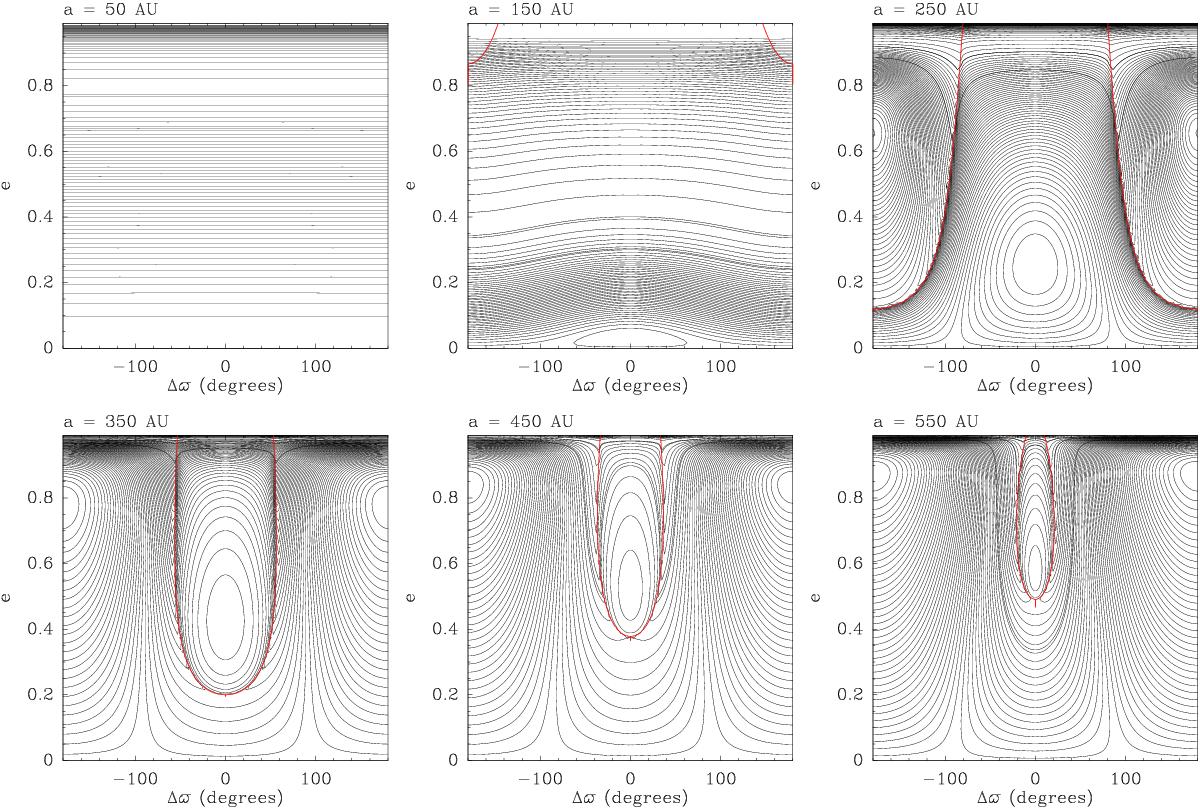
Phase portraits of untruncated, secular averaged Hamiltonian (1) in (Δϖ,e) space, computed in the same conditions as B16, i.e. assuming parameters m′ = 10 M⊕, a′ = 700 au and e′ = 0.6 for P9. Plots are drawn for various semi-major axis values listed on top of the panels. On each plot, the red curve separates regions where both orbits cross from regions where they do not. In the a = 50 au case, the orbits never cross; for a = 150 au and a = 250 au, the orbits cross in the regions located above the red curves around Δϖ = 180°; for a = 350 au, a = 450 au and a = 550 au, the orbits cross in most configurations, except above the red curves centred around Δϖ = 0° where both orbits remain nested.
Current usage metrics show cumulative count of Article Views (full-text article views including HTML views, PDF and ePub downloads, according to the available data) and Abstracts Views on Vision4Press platform.
Data correspond to usage on the plateform after 2015. The current usage metrics is available 48-96 hours after online publication and is updated daily on week days.
Initial download of the metrics may take a while.