Fig. 1
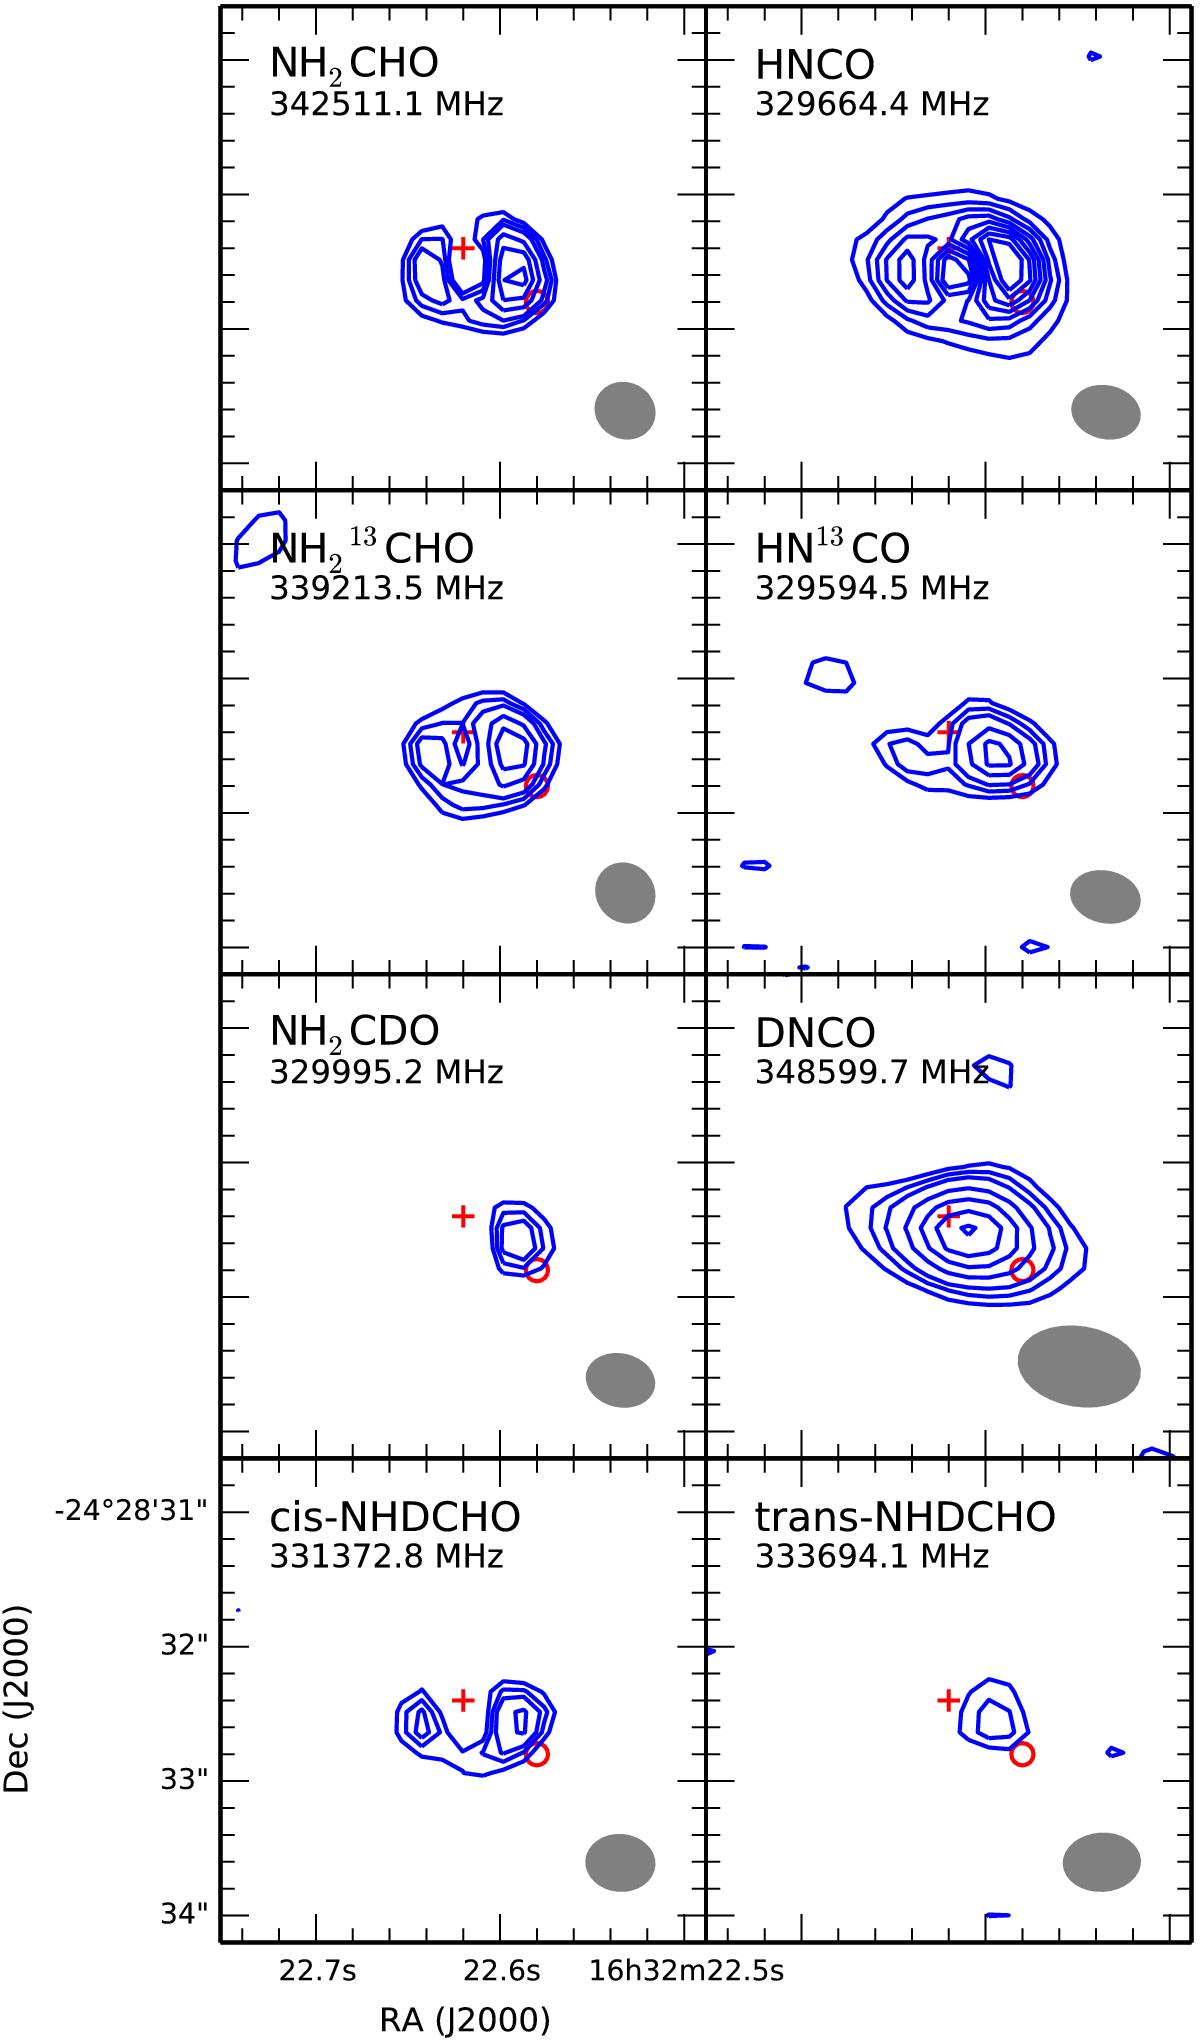
Integrated intensity maps of NH2CHO, HNCO, and their isotopologues towards source B. The position of the continuum peak of source B is indicated with a red cross, while the position of where the spectrum was extracted is shown with a red circle. The beam sizes are shown in gray in the bottom right corner of each panel. The contour levels start for the main isotopologue of HNCO at 0.05 Jy km s-1 with a step of 0.05 Jy km s-1. For the other species, the levels are 0.02, 0.03, 0.04, 0.06, 0.08, 0.1, and 0.12 Jy km s-1.
Current usage metrics show cumulative count of Article Views (full-text article views including HTML views, PDF and ePub downloads, according to the available data) and Abstracts Views on Vision4Press platform.
Data correspond to usage on the plateform after 2015. The current usage metrics is available 48-96 hours after online publication and is updated daily on week days.
Initial download of the metrics may take a while.